

Question: Please draw the box and whisker plot by labeling each number. The following data are the maximum temperatures (in degrees Fahrenheit) of 17 cities in
Please draw the box and whisker plot by labeling each number.
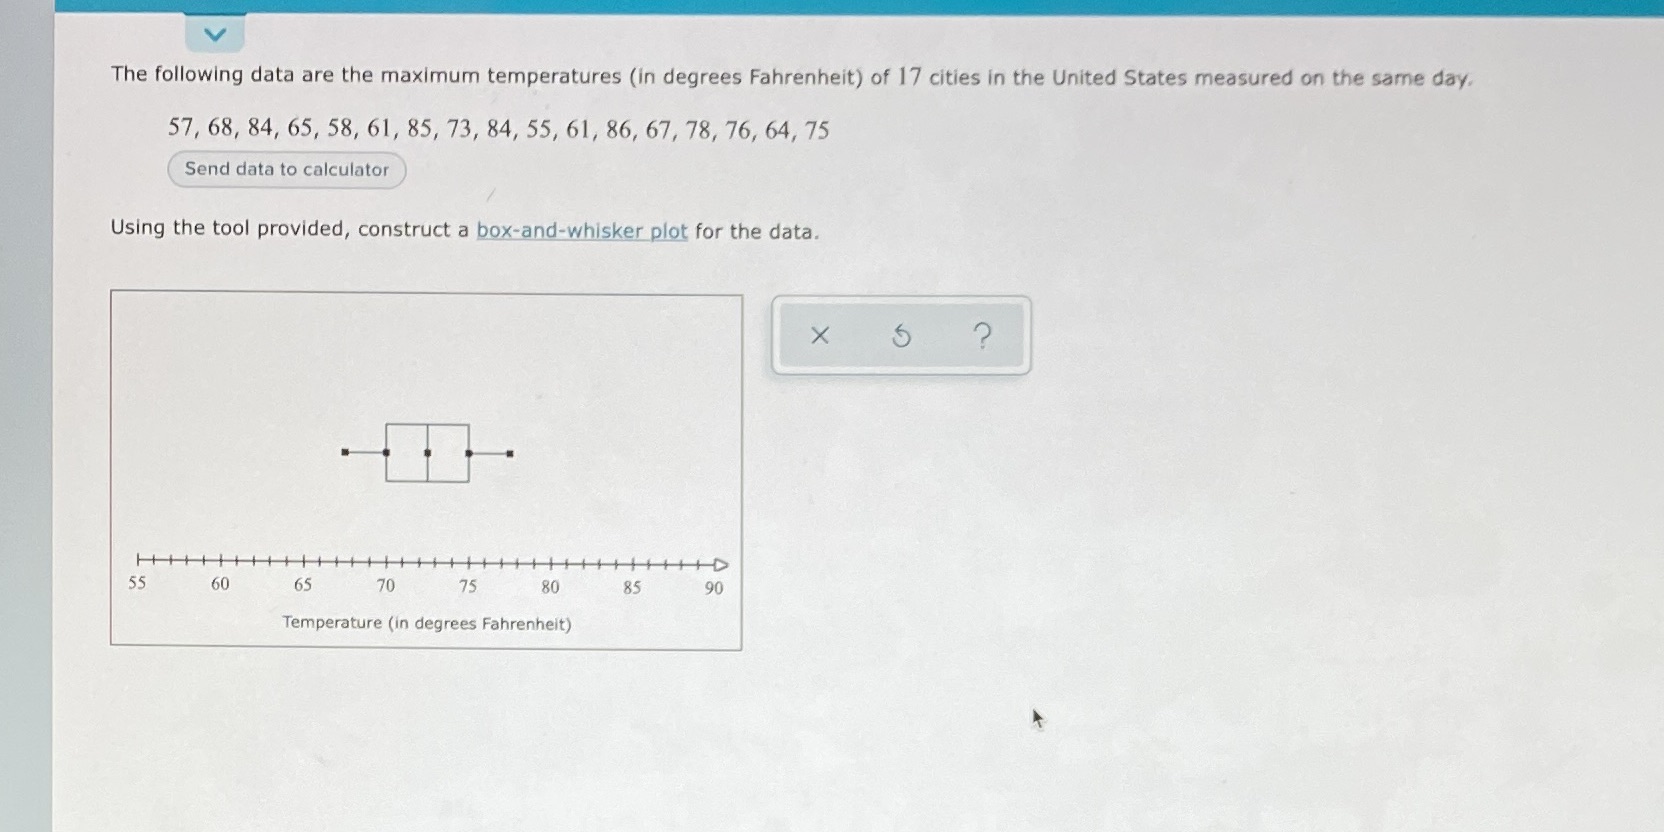
The following data are the maximum temperatures (in degrees Fahrenheit) of 17 cities in the United States measured on the same day. 57, 68, 84, 65, 58, 61, 85, 73, 84, 55, 61, 86, 67, 78, 76, 64, 75 Send data to calculator Using the tool provided, construct a box-and-whisker plot for the data. X ? 55 60 65 70 75 80 85 90 Temperature (in degrees Fahrenheit)
Step by Step Solution
There are 3 Steps involved in it
1 Expert Approved Answer
Step: 1 Unlock

Question Has Been Solved by an Expert!
Get step-by-step solutions from verified subject matter experts
Step: 2 Unlock
Step: 3 Unlock