

Question: please draw the CVP graph in the cartesian coordinate system based on the example given in class (you will find all info. in the class
please draw the CVP graph in the cartesian coordinate system based on the example given in class (you will find all info. in the class note), you must show:
1. Total revenue
2. Variable expenses
3. Fixed expenses
4. Break-even point
5. Highlight Loss area and Profit area with different colors
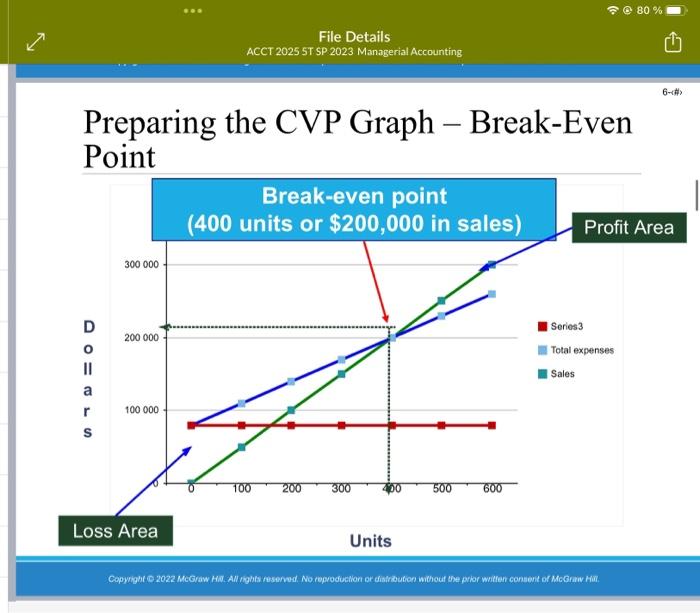
Preparing the CVP Graph - Break-Even Point
Step by Step Solution
There are 3 Steps involved in it
1 Expert Approved Answer
Step: 1 Unlock

Question Has Been Solved by an Expert!
Get step-by-step solutions from verified subject matter experts
Step: 2 Unlock
Step: 3 Unlock