

Question: please draw the diagram in question b and solve c a) A series of age hardening curves for an Mg5wt%Zn alloy is given in fig.
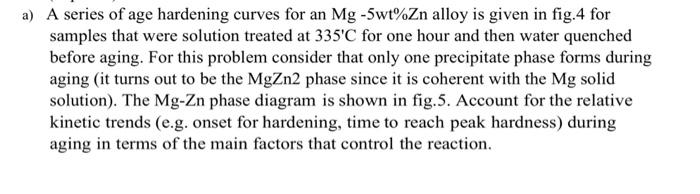
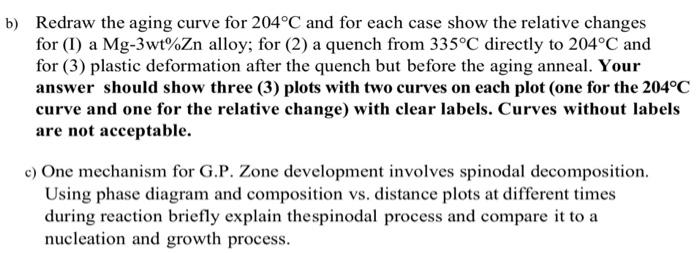
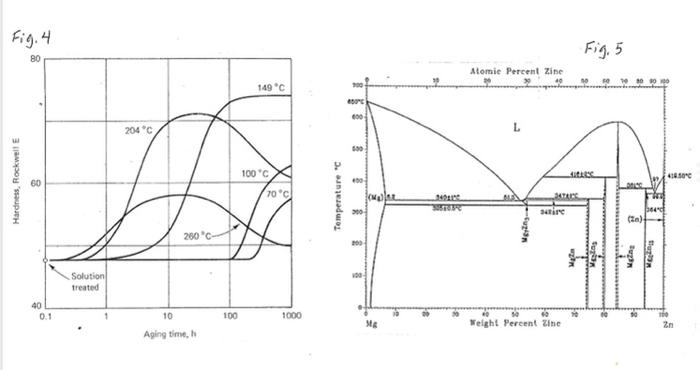
a) A series of age hardening curves for an Mg5wt%Zn alloy is given in fig. 4 for samples that were solution treated at 335C for one hour and then water quenched before aging. For this problem consider that only one precipitate phase forms during aging (it turns out to be the MgZn2 phase since it is coherent with the Mg solid solution). The MgZn phase diagram is shown in fig.5. Account for the relative kinetic trends (e.g. onset for hardening, time to reach peak hardness) during aging in terms of the main factors that control the reaction. Redraw the aging curve for 204C and for each case show the relative changes for (I) a Mg-3wt\%Zn alloy; for (2) a quench from 335C directly to 204C and for (3) plastic deformation after the quench but before the aging anneal. Your answer should show three (3) plots with two curves on each plot (one for the 204C curve and one for the relative change) with clear labels. Curves without labels are not acceptable. c) One mechanism for G.P. Zone development involves spinodal decomposition. Using phase diagram and composition vs. distance plots at different times during reaction briefly explain thespinodal process and compare it to a nucleation and growth process. Fig. 4 Aping time, h Fig. 5 a) A series of age hardening curves for an Mg5wt%Zn alloy is given in fig. 4 for samples that were solution treated at 335C for one hour and then water quenched before aging. For this problem consider that only one precipitate phase forms during aging (it turns out to be the MgZn2 phase since it is coherent with the Mg solid solution). The MgZn phase diagram is shown in fig.5. Account for the relative kinetic trends (e.g. onset for hardening, time to reach peak hardness) during aging in terms of the main factors that control the reaction. Redraw the aging curve for 204C and for each case show the relative changes for (I) a Mg-3wt\%Zn alloy; for (2) a quench from 335C directly to 204C and for (3) plastic deformation after the quench but before the aging anneal. Your answer should show three (3) plots with two curves on each plot (one for the 204C curve and one for the relative change) with clear labels. Curves without labels are not acceptable. c) One mechanism for G.P. Zone development involves spinodal decomposition. Using phase diagram and composition vs. distance plots at different times during reaction briefly explain thespinodal process and compare it to a nucleation and growth process. Fig. 4 Aping time, h Fig. 5
Step by Step Solution
There are 3 Steps involved in it

Get step-by-step solutions from verified subject matter experts