

Question: please draw the graph in detailed Question [5 Marks) A Human Resource Department of a company recorded data of seven (7) randomly selected employees as
 please draw the graph in detailed
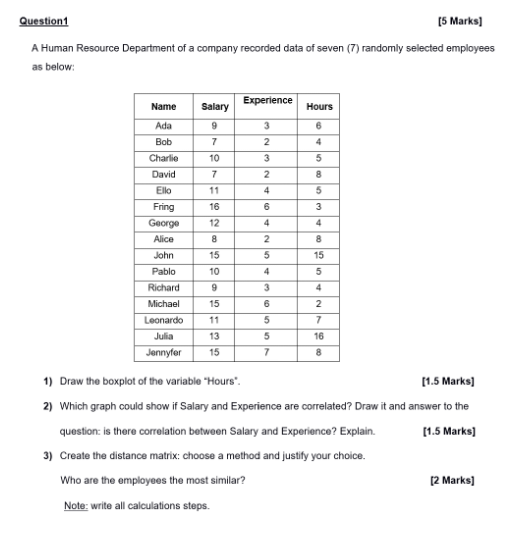
Question [5 Marks) A Human Resource Department of a company recorded data of seven (7) randomly selected employees as below: Experience Name Hours Salary 9 6 7 4 3 2 3 2 10 5 7 8 11 4 5 6 3 16 12 8 4 Ada Bob Charlie David Ello Fring George Alice John Pablo Richard Michael Leonardo Julia Jennyfer 4 2 8 15 5 4 3 15 5 10 9 4 15 2 11 7 5 5 7 13 15 16 8 1) Draw the boxplot of the variable Hours". [1.5 Marks] 2) Which graph could show if Salary and Experience are correlated? Draw it and answer to the question is there correlation between Salary and Experience? Explain. [1.5 Marks] 3) Create the distance matrix: choose a method and justify your choice. Who are the employees the most similar? [2 Marks) Note: write all calculations steps
Step by Step Solution
There are 3 Steps involved in it

Get step-by-step solutions from verified subject matter experts