

Question: Please draw the graphs so I can understand the shape! Figure 4 is included in the pictures. Thanks in advance! For the full - wave
Please draw the graphs so I can understand the shape! Figure is included in the pictures. Thanks in advance!
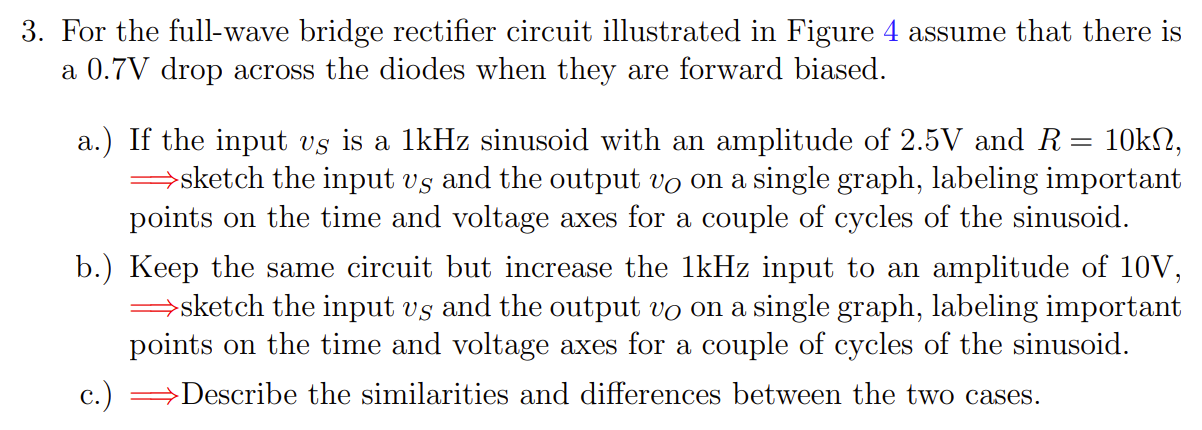
For the fullwave bridge rectifier circuit illustrated in Figure assume that there is
a V drop across the diodes when they are forward biased.
avS is a kHz sinusoid with an amplitude of V and RkOmega
sketch the input vS and the output vO on a single graph, labeling important
points on the time and voltage axes for a couple of cycles of the sinusoid
bLongrightarrow sketch the input vS and the output vO on a single graph, labeling important
points on the time and voltage axes for a couple of cycles of the sinusoid
cLongrightarrow Describe the similarities and differences between the two cases.
Figure : Fullwave Bridge Rectifier
Step by Step Solution
There are 3 Steps involved in it
1 Expert Approved Answer
Step: 1 Unlock

Question Has Been Solved by an Expert!
Get step-by-step solutions from verified subject matter experts
Step: 2 Unlock
Step: 3 Unlock