

Question: Please draw the restriction for the graph Price Quantity Quantity Demanded Supplied Market for Airline Seats $200 2,000 1,200 800- $300 1,800 1,400 $400 1,600
Please draw the restriction for the graph
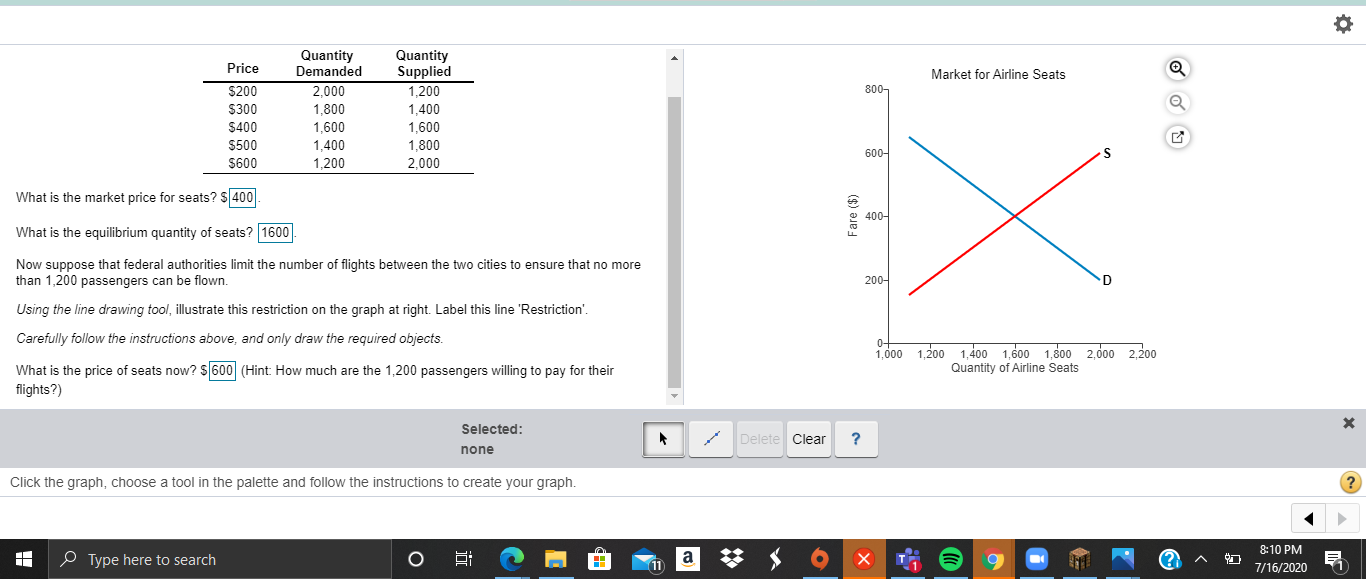
Price Quantity Quantity Demanded Supplied Market for Airline Seats $200 2,000 1,200 800- $300 1,800 1,400 $400 1,600 1,600 $500 1,400 1,800 $600 1,200 2.000 600- What is the market price for seats? $ 400 Fare ($) 400- What is the equilibrium quantity of seats? 1600 Now suppose that federal authorities limit the number of flights between the two cities to ensure that no more than 1,200 passengers can be flown. 200- Using the line drawing tool, illustrate this restriction on the graph at right. Label this line 'Restriction'. Carefully follow the instructions above, and only draw the required objects. 0- 1,000 1,200 1,400 1,600 1,800 2,000 2,200 What is the price of seats now? $ 600 (Hint: How much are the 1,200 passengers willing to pay for their Quantity of Airline Seats flights?) Selected: X none Delete Clear ? Click the graph, choose a tool in the palette and follow the instructions to create your graph. ? + Type here to search O a X 8:10 PM 7/16/2020 E
Step by Step Solution
There are 3 Steps involved in it

Get step-by-step solutions from verified subject matter experts