

Question: Please either LP Programming Equation setup or via tables in Excel to solve with Solver At the beginning of each day, a patient in a
Please either LP Programming Equation setup or via tables in Excel to solve with Solver
At the beginning of each day, a patient in a hospital is classified into one of three conditions; good, fair, or critical. At the beginning of the next day, the patient will either continue to be in the hospital and be in good, fair or critical condition or the patient will be discharged in one of three conditions: improved, unimproved or dead. The transition probabilities for these situations are as follows:
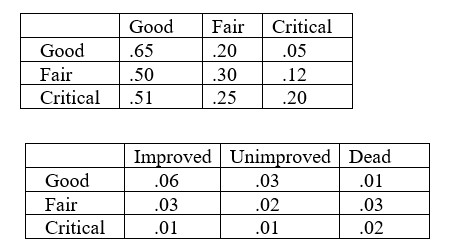
Fair Critical Good .65 .20 .05 Fair .50 .30 .12 Critical .51 .25 .20 Improved Unimproved Dead Good .06 .03 .01 Fair .03 .02 .03 Critical .01 .01 .02 For example, a patient who begins the day in fair condition has a 12% chance of being in critical condition the next day and a 3% chance of being discharged the next day in improved condition. a. Consider a patient who enters the hospital in good condition. On average, how many days does this patient spend in the hospital? b. This morning, there were 500 patients in good condition, 300 in fair condition, and 200 patients in critical condition in the hospital. Tomorrow morning, the following admissions will be made: 50 patients in good condition, 40 in fair condition and 30 patients in critical condition. On the basis of this, predict tomorrows hospital census (how many patients in good, critical and fair condition, total)? c. The hospitals daily admissions are as follows: 20 patients in good condition, 10 patients in fair condition and 10 patients in critical condition. On average, how many patients of each type would you expect to see in the hospital (think steady state conditions)? d. What fraction of patients who enter the hospital in good condition, will leave in improved condition?
\begin{tabular}{|l|l|l|c|} \hline & Good & Fair & Critical \\ \hline Good & .65 & .20 & .05 \\ \hline Fair & .50 & .30 & .12 \\ \hline Critical & .51 & .25 & .20 \\ \hline \end{tabular} \begin{tabular}{|l|c|c|c|} \hline & Improved & Unimproved & Dead \\ \hline Good & .06 & .03 & .01 \\ \hline Fair & .03 & .02 & .03 \\ \hline Critical & .01 & .01 & .02 \\ \hline \end{tabular}Step by Step Solution
There are 3 Steps involved in it

Get step-by-step solutions from verified subject matter experts