

Question: Please elaborate how you got the answer. also if you use excel if you could show which formulas and maybe show the formula filled in
Please elaborate how you got the answer. also if you use excel if you could show which formulas and maybe show the formula filled in before it computes the answer, that would be amazing! Thank you in advance!
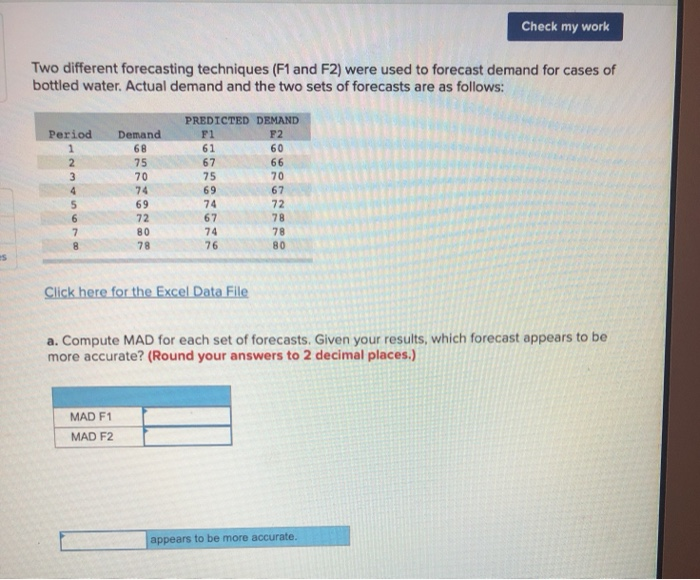
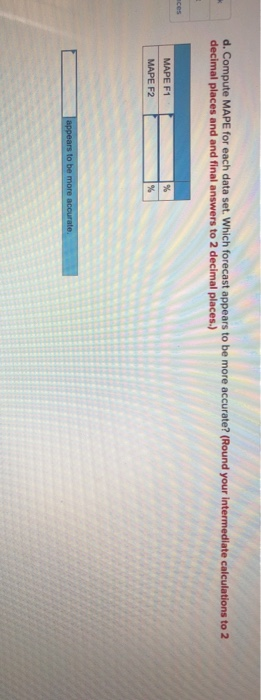
Check my work Two different forecasting techniques (F1 and F2) were used to forecast demand for cases of bottled water. Actual demand and the two sets of forecasts are as follows: Period 1 2 3 4 5 6 7 8 Demand 68 75 70 74 69 72 80 78 PREDICTED DEMAND F1 F2 61 60 67 66 75 70 69 67 72 67 78 74 78 76 80 74 N Click here for the Excel Data File a. Compute MAD for each set of forecasts. Given your results, which forecast appears to be more accurate? (Round your answers to 2 decimal places.) MAD F1 MAD F2 appears to be more accurate. * d. Compute MAPE for each data set. Which forecast appears to be more accurate? (Round your intermediate calculations to 2 decimal places and and final answers to 2 decimal places.) MAPE F1 MAPE F2 % appears to be more accurateStep by Step Solution
There are 3 Steps involved in it
1 Expert Approved Answer
Step: 1 Unlock

Question Has Been Solved by an Expert!
Get step-by-step solutions from verified subject matter experts
Step: 2 Unlock
Step: 3 Unlock