

Question: please explain and analyse this data as i have to submit report, explain what happened during these 4 years what increased what decreased. i have
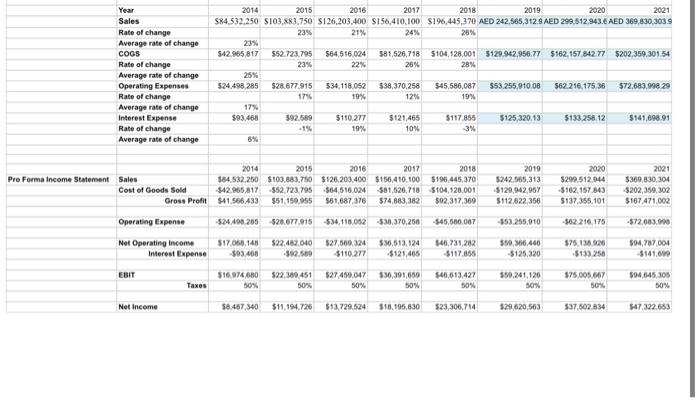
23% $42,965,817 $52.723,795 Rate of change 23% $64,516,024 22% Year Sales Rate of change Average rate of change COGS 2014 2015 2016 2017 2019 2020 2021 $84,532,250 $103,883,750 $126,203,400 $156,410,100 $196,445,370 AED 242.565,312.9 AED 299,512.943.6 AED 369,830,303.9 23% 21% 2018 24% 26% $81,526,718 $104,128,001 $129.942,956.77 $162.157.842.77 $202,359,301.54 26% 28% Average rate of change 25% Operating Expenses $24,498,285 Rate of change $28.677,915 17% $34,118.052 19% $38,370,258 12% $45,586,087 19% $53,255,910.08 $62,216,175.36 $72,683,998.29 Average rate of change 17% Interest Expense $93,468 Rate of change $92.589 -1% $110.277 19% $121,465 10% $117,855 3% $125,320.13 $133.258.12 $141,698.91 Average rate of change 6% Pro Forma Income Statement Sales Cost of Goods Sold 2014 $84,532,250 $42.965,817 Gross Profit $41.566.433 2015 $103,883,750 2016 2017 2018 2019 2020 2021 $126,203,400 $156,410,100 $196,445,370 $52,723,795 $64,516.024 $81,526,718 $104,128,001 $51,159,955 $61,687,376 $74,883,382 $242.565,313 $129,942,957 $299.512.944 -$162.157.843 $369,830,304 $202,359,302 $92,317,369 $112.622,356 $137,355.101 $167,471,002 Operating Expense $24.498.285 $28.677.915 $34.118.052 $38,370,250 $45,500.007 -$53,255,010 -$62.216,175 -$72.683.098 Net Operating Income Interest Expense $17,068,148 $93.468 $22,482,040 $92.589 $27,569.324 $110.277 $36,513,124 -$121,405 $46,731,282 $117.855 $50,366,440 -$125,320 $75,138,926) $94,787,004 -$133.258 -$141.099 EBIT $16,974,680 $22.389,451 $27,459,047 50% 50% 50% $36,391,659 50% $46,613,427 $50,241,120 $75.005.667 $94,645,305 50% 50% 50% 50% Net Income $8,487,340 $11,194,726 $13,729,524 $18,195,830 $23,306,714 $29,620,563 $37.502.834 $47,322.653
Step by Step Solution
There are 3 Steps involved in it

Get step-by-step solutions from verified subject matter experts