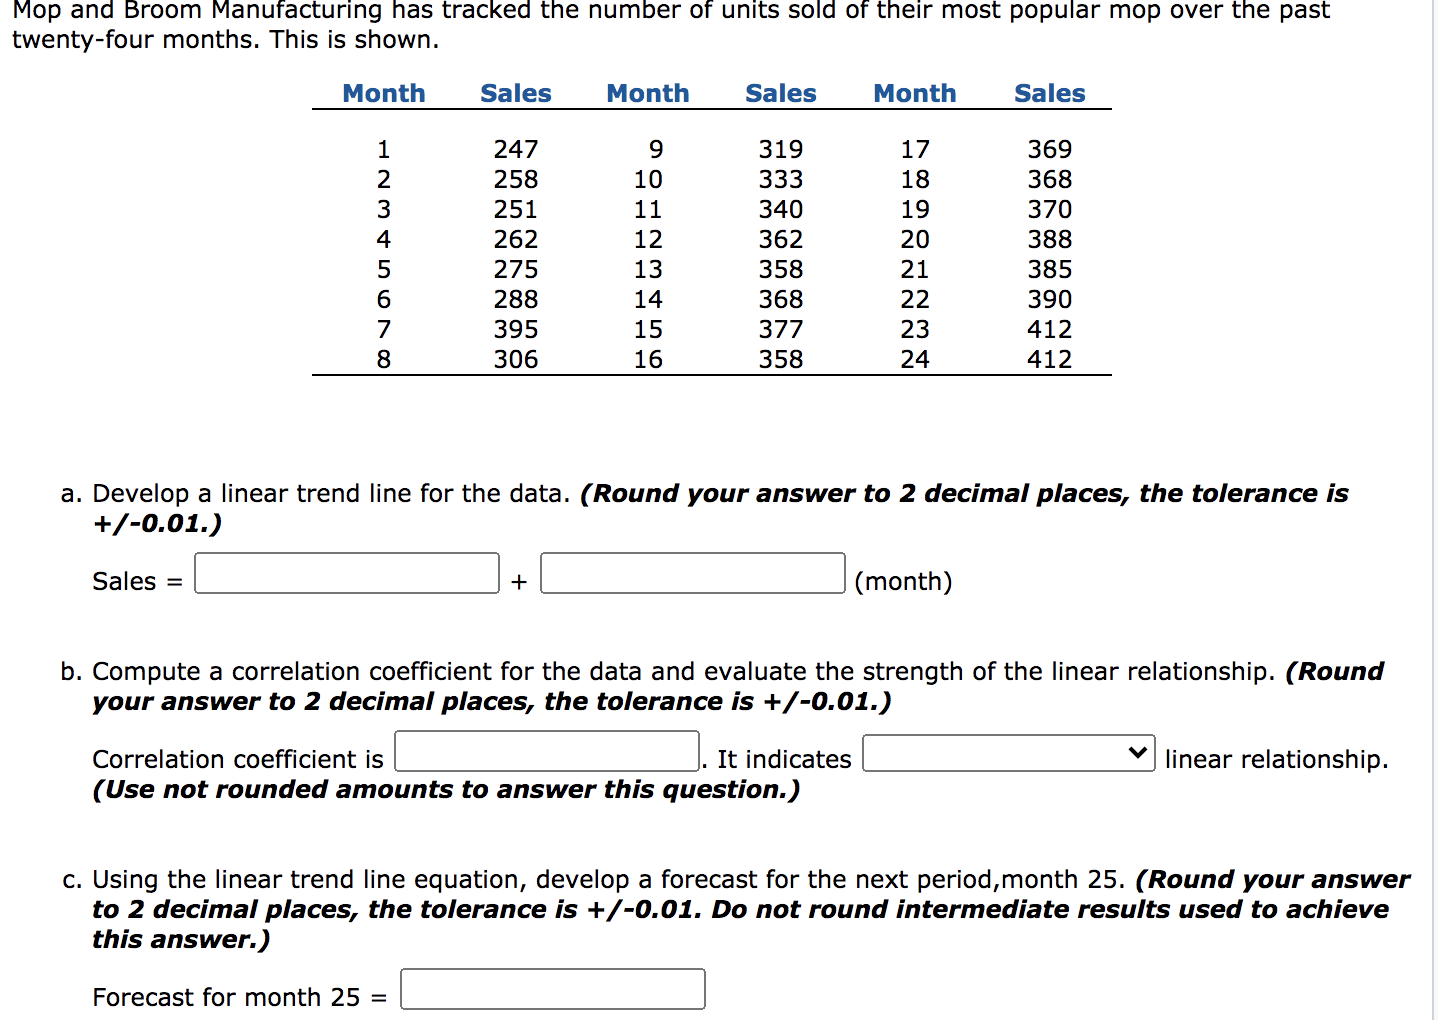
Question: please explain and show steps Mop and Broom Manufacturing has tracked the number of units sold of their most popular mop over the past twenty-four

please explain and show steps

please explain and show steps Mop and Broom

Mop and Broom Manufacturing has tracked the number of units sold of their most popular mop over the past twenty-four months. This is shown. Month Sales Month Sales Month Sales 1 2 3 4 5 6 7 8 247 258 251 262 275 288 395 306 9 10 11 12 13 14 319 333 340 362 358 368 377 358 17 18 19 20 21 22 23 24 369 368 370 388 385 390 412 412 15 16 a. Develop a linear trend line for the data. (Round your answer to 2 decimal places, the tolerance is +/-0.01.) Sales = + (month) b. Compute a correlation coefficient for the data and evaluate the strength of the linear relationship. (Round your answer to 2 decimal places, the tolerance is +/-0.01.) linear relationship. Correlation coefficient is It indicates (Use not rounded amounts to answer this question.) c. Using the linear trend line equation, develop a forecast for the next period,month 25. (Round your answer to 2 decimal places, the tolerance is +/-0.01. Do not round intermediate results used to achieve this answer.) Forecast for month 25 =

Step by Step Solution

There are 3 Steps involved in it

1 Expert Approved Answer
Step: 1 Unlock blur-text-image
Question Has Been Solved by an Expert!

Get step-by-step solutions from verified subject matter experts

Step: 2 Unlock
Step: 3 Unlock

Students Have Also Explored These Related General Management Questions!