

Question: please explain answers solve the equation, using rhe graph provided with the questions below the chart PROBLEM 1: In an assembly line, there are 7
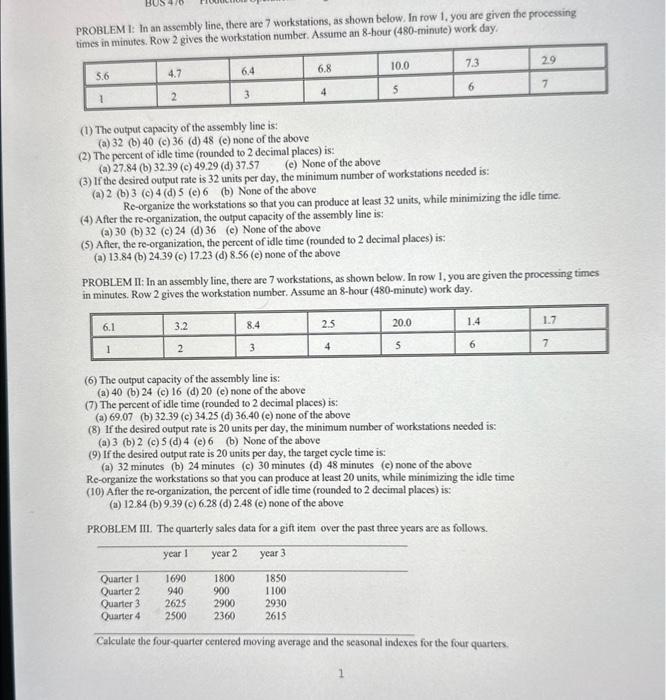
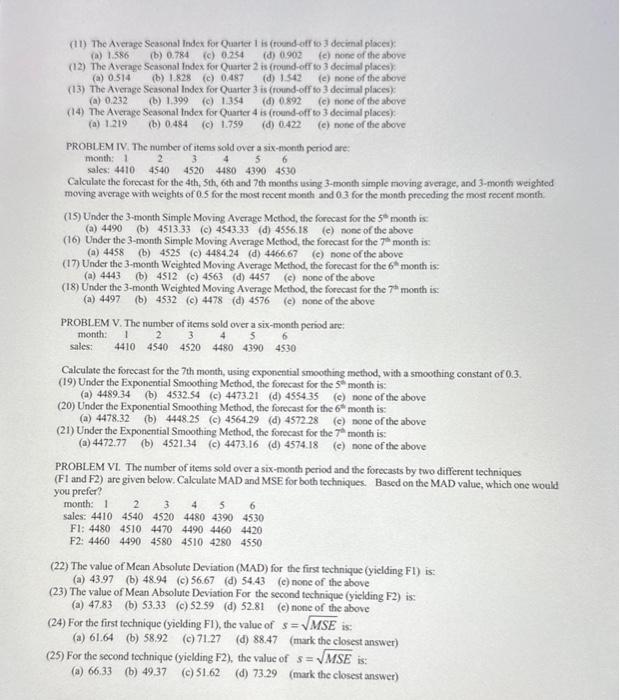
PROBLEM 1: In an assembly line, there are 7 workstations, as shown below. In row 1, you are given the processing ti- tin minatae Row 2 eives the workstation number. Assume an 8-hour (480-minute) work day. (1) The output capacity of the assembly line is: (a) 32 (b) 40 (c) 36 (d) 48 (e) none of the above (2) The percent of idle time (rounded to 2 decimal places) is: (a) 27.84 (b) 32.39 (c) 49.29 (d) 37.57 (e) None of the above (3) If the desired output rate is 32 units per day, the minimum number of workstations needed is: (a) 2 (b) 3 (c) 4 (d) 5 (c) 6 (b) None of the above Re-organize the workstations so that you can produce at least 32 units, while minimizing the idle time. (4) After the re-organization, the output capacity of the assembly line is: (a) 30 (b) 32 (c) 24 (d) 36 (c) None of the above (5) After, the re-organization, the percent of idle time (rounded to 2 decimal places) is: (a) 13.84 (b) 24.39 (c) 17.23 (d) 8.56 (c) none of the above PROBLEM II: In an assembly line, there are 7 workstations, as shown below. In row 1, you are given the processing times in minutes. Row 2 gives the workstation number. Assume an 8-hour (480-minute) work day. (6) The output capacity of the assembly line is: (a) 40 (b) 24 (c) 16 (d) 20 (e) none of the above (7) The percent of idle time (rounded to 2 decimal places) is: (a) 69.07 (b) 32.39 (c) 34.25 (d) 36.40 (e) none of the above (8) If the desired output rate is 20 units per day, the minimum number of workstations needed is: (a) 3 (b) 2 (c) 5 (d) 4 (e) 6 (b) None of the above (9) If the desired output rate is 20 units per day, the target cycle time is: (a) 32 minutes (b) 24 minutes (c) 30 minutes (d) 48 minutes (c) none of the above Re-organize the workstations so that you can produce at least 20 units, while minimizing the idle time (10) After the re-organization, the percent of idle time (rounded to 2 decimal places) is: (a) 12.84 (b) 9.39 (c) 6.28 (d) 2.48 (e) none of the above PROBLEM IIL. The quarterly sales data for a gift item over the past three years are as follows. Calculate the four-quarter centered moving average and the seasonal indexes for the four quarters. (11) The Averuge Seasonal Indek for Quarter 1 is (roend-off to 3 decimal places): (a) 1.586 (b) 0.784 (c) 0.254 (d) 0.902 (c) noire of the above (12) The Average Scasonal lndex for Quarter 2 is (round-off to 3 decimal places) (a) 0.514 (b) 1.828 (c) 0.487 (d) 1.42 (c) notic of the above (13) The Average Scasonal Index for Quarter 3 is (round-off to 3 decimal places): (a) 0.232 (b) 1,399 (c) 1.354 (d) 0.892 (c) none of the above (14) The Average Seasonal Index for Quarter 4 is (round-off to 3 decimal places): (a) 1219 (b) 0.484 (c) 1.759 (d) 0.422 (c) none of the above PROBLEM IV. The number of items sold over a six-month period are: month:1sales:44102454034520444805439064530 Calculate the forecast for the 4 th, 5 th, 6th and 7 th months using 3-month simple moving avernge, and 3-month weighted moving average with weights of 0.5 for the most recerit month and 0.3 for the month preceding the most recent month. (15) Under the 3-month Simple Moving Average Method, the forecast for the 5 month is: (a)4490(b)4513.33(c)4543.33(d)4556.18(c)noneoftheabove (16) Under the 3-month Simple Moving Average Method, the forecast for the 7 month is: (a) 4458 (b) 4525 (c) 4484.24 (d) 4466.67 (c) none of the above (17) Under the 3-month Weighted Moving Average Method, the forecast for the 6t month is: (a) 4443 (b) 4512 (c) 4563 (d) 4457 (c) none of the above (18) Under the 3-month Weighted Moving Average Method, the forecast for the 7t month is: (a) 4497 (b) 4532 (c) 4478 (d) 4576 (c) none of the above PROBL EM V. The number of items sold over a six-month period are: month:sales:144102454034520444805439064530 Calculate the forecast for the 7 th month, using exponential smoothing method, with a smoothing constant of 0.3. (19) Under the Exponential Smoothing Method, the forecast for the 5m month is: (a) 4489.34 (b) 4532.54 (c) 4473.21 (d) 455+35 (c) nooe of the above (20) Under the Exponential Smoothing Method, the forecast for the 6w month is: (a) 4478.32 (b) 4448.25 (c) 4564.29 (d) 4572.28 (c) none of the above (21) Under the Exponential Smoothing Method, the forecast for the 7t month is: (a) 4472.77 (b) 4521.34 (c) 4473.16 (d) 4574.18 (c) none of the above PROBLEM VI. The number of items sold over a six-month period and the forecasts by two different techniques (F1 and F2) are given below. Calculate MAD and MSE for both techniques. Based on the MAD value, which one would you prefer? month:1sales:4410F1:4480F2:446024540451044903452044704580444804490451054390446042806453044204550 (22) The value of Mean Absolute Deviation (MAD) for the first technique (yielding Fl) is: (a) 43.97 (b) 48.94 (c)56.67(d)54.43(c)noneoftheabove (23) The value of Mean Absolute Deviation For the second technique (yiclding F2) is: (a) 47.83 (b) 53.33 (c) 52.59 (d) 52.81 (c) none of the above (24) For the first technique (yielding F1), the value of s=MSE is: (a) 61.64 (b) 58.92 (c) 7127 (d) 88.47 (mark the closest answer) (25) For the second technique (yielding F2), the value of s=MSE is: (a) 66.33 (b) 4937 (c) 51.62 (d) 73.29 (mark the closest answer)
Step by Step Solution
There are 3 Steps involved in it

Get step-by-step solutions from verified subject matter experts