

Question: Please explain below, please explain in details step by step to understand this better. Thank you fCalculate SSE, s2, and s for the least squares
Please explain below, please explain in details step by step to understand this better. Thank you
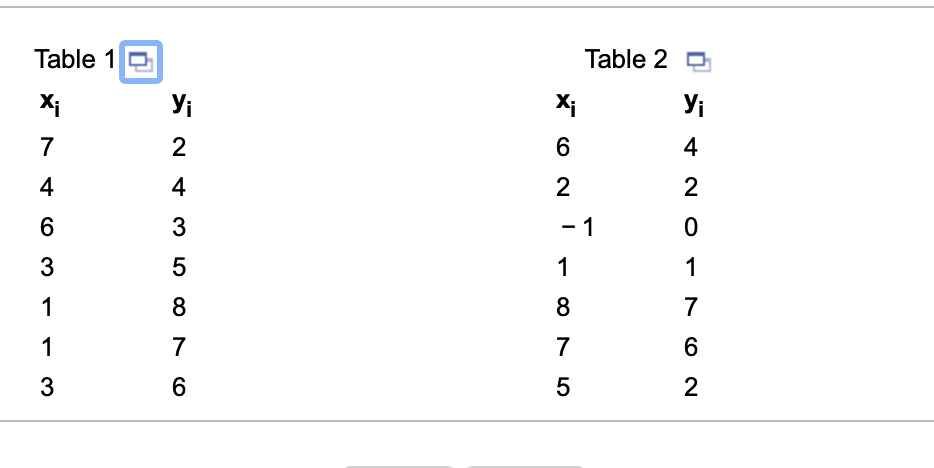
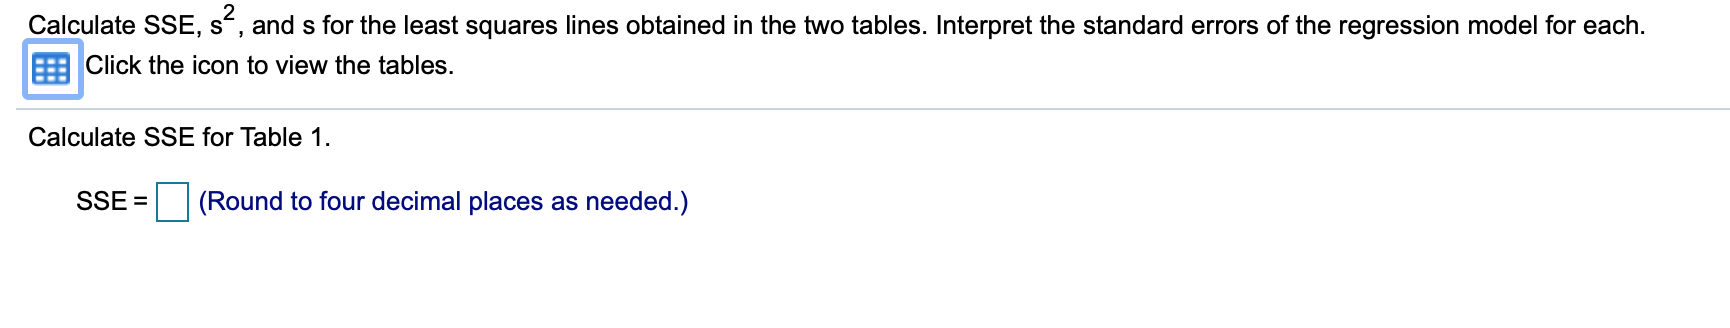
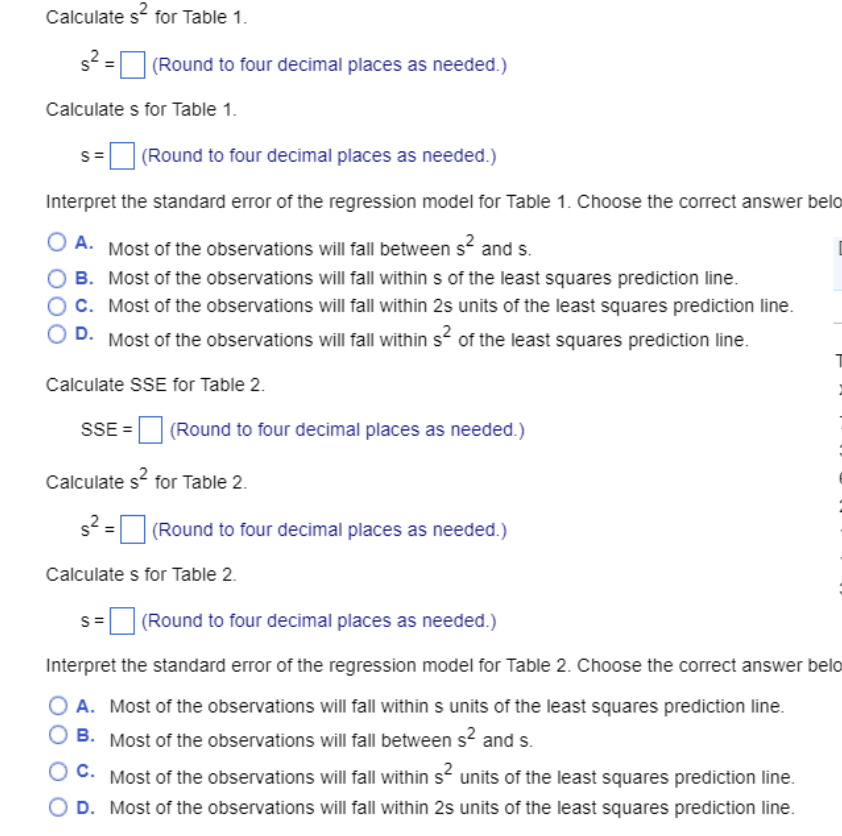
\fCalculate SSE, s2, and s for the least squares lines obtained in the two tables. Interpret the standard errors of the regression model for each. .Click the icon to view the tables. Calculate SSE for Table 1. SSE = D (Round to four decimal places as needed.) Calculate 52 for Table 1. 52 = D (Round to four decimal places as needed.) Calculate s for Table 1. s = D (Round to four decimal places as needed.) Interpret the standard error of the regression model for Table 1. Choose the conect answer belo O A' M081 0" the observations Will fall between 52 and S. I O B. Most of the observations will fall within 5 of the least squares prediction line. 0 c. Most of the observations will fall within 25 units of the least squares prediction line. 0 0- Most of the observations will fall within 32 ottlie least squares prediction line. Calculate SSE tor Table 2. ; SSE = I] (Round to tour decimal places as needed.) Calculate 52 for Table 2. l 52 = D (Round to tour decimal places as needed.) Calculate s for Table 2. s = D (Round to four decimal places as needed.) Interpret the standard error of the regression model for Table 2. Choose the conect answer belo O A. Most of the observations will fall within 5 units of the least squares prediction line. 0 3- Most of the observations will fall between 52 and s. O '3' Most of the observations will fall within 52 units of the least squares prediction line. 0 D. Most of the observations will fall within 25 units of the least squares prediction line
Step by Step Solution
There are 3 Steps involved in it

Get step-by-step solutions from verified subject matter experts