

Question: Please explain clearly in excel sheet. thank you so much!! The Procter & Gamble Company (PG): NYSE Date Open High Low Close Adj Close Volume
Please explain clearly in excel sheet. thank you so much!!
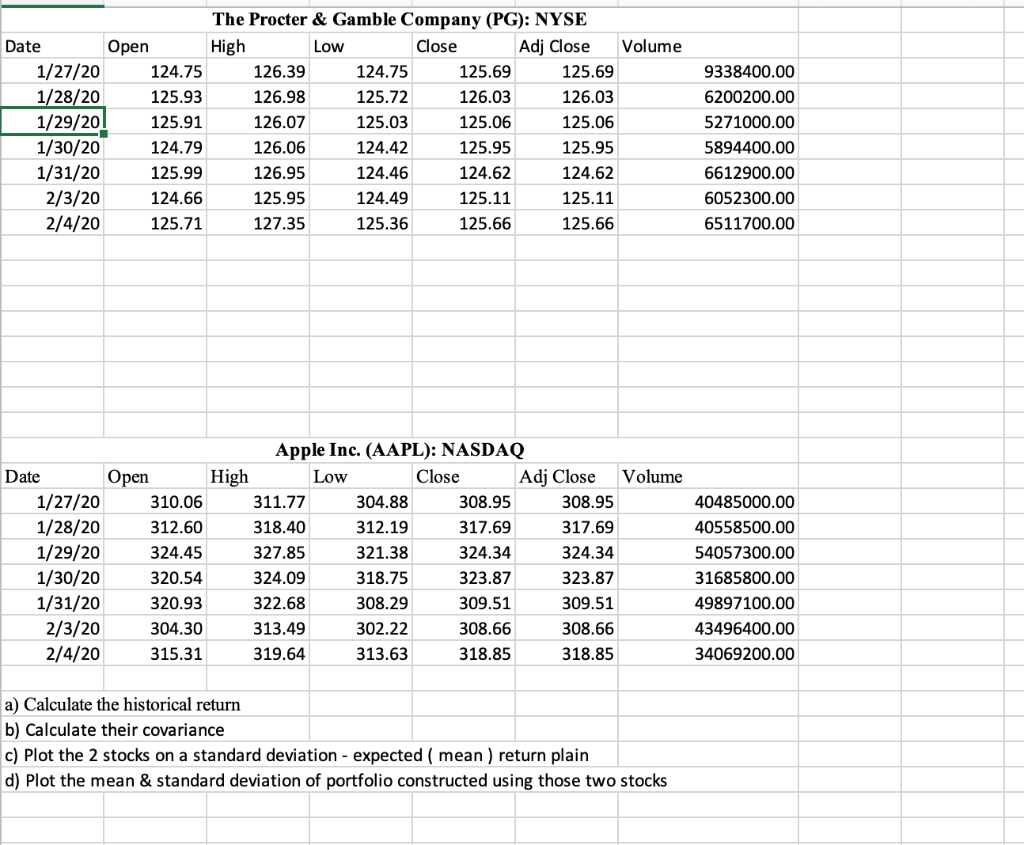
The Procter & Gamble Company (PG): NYSE Date Open High Low Close Adj Close Volume 1/27/20 124.75 126.39 124.75 125.69 125.69 1/28/20 125.93 126.98 125.72 126.03 126.03 1/29/20! 125.91 126.07 125.03 125.06 125.06 1/30/20 124.79 126.06 124.42 125.95 125.95 1/31/20 125.99 126.95 124.46 124.62 124.62 2/3/20 124.66 125.95 124.49 125.11 125.11 2/4/20 125.71 127.35 125.36 125.66 125.66 9338400.00 6200200.00 5271000.00 5894400.00 6612900.00 6052300.00 6511700.00 pen Apple Inc. (AAPL): NASDAQ Date Open High Low Close Adj Close Volume 1/27/20 310.06 311.77 304.88 308.95 308.95 40485000.00 1/28/20 312.60 318.40 312.19 317.69 317.69 40558500.00 1/29/20 324.45 327.85 321.38 324.34 324.34 54057300.00 1/30/20 320.54 324.09 318.75 323.87 323.87 31685800.00 1/31/20 320.93 322.68 308.29 309.51 309.51 49897100.00 2/3/20 304.30 313.49 302.22 308.66 308.66 43496400.00 2/4/20 315.31 319.64 313.63 318.85 318.85 34069200.00 a) Calculate the historical return b) Calculate their covariance c) Plot the 2 stocks on a standard deviation - expected (mean ) return plain d) Plot the mean & standard deviation of portfolio constructed using those two stocks The Procter & Gamble Company (PG): NYSE Date Open High Low Close Adj Close Volume 1/27/20 124.75 126.39 124.75 125.69 125.69 1/28/20 125.93 126.98 125.72 126.03 126.03 1/29/20! 125.91 126.07 125.03 125.06 125.06 1/30/20 124.79 126.06 124.42 125.95 125.95 1/31/20 125.99 126.95 124.46 124.62 124.62 2/3/20 124.66 125.95 124.49 125.11 125.11 2/4/20 125.71 127.35 125.36 125.66 125.66 9338400.00 6200200.00 5271000.00 5894400.00 6612900.00 6052300.00 6511700.00 pen Apple Inc. (AAPL): NASDAQ Date Open High Low Close Adj Close Volume 1/27/20 310.06 311.77 304.88 308.95 308.95 40485000.00 1/28/20 312.60 318.40 312.19 317.69 317.69 40558500.00 1/29/20 324.45 327.85 321.38 324.34 324.34 54057300.00 1/30/20 320.54 324.09 318.75 323.87 323.87 31685800.00 1/31/20 320.93 322.68 308.29 309.51 309.51 49897100.00 2/3/20 304.30 313.49 302.22 308.66 308.66 43496400.00 2/4/20 315.31 319.64 313.63 318.85 318.85 34069200.00 a) Calculate the historical return b) Calculate their covariance c) Plot the 2 stocks on a standard deviation - expected (mean ) return plain d) Plot the mean & standard deviation of portfolio constructed using those two stocks
Step by Step Solution
There are 3 Steps involved in it

Get step-by-step solutions from verified subject matter experts