

Question: please explain clearly. thank you What about the graphs in the previous question led you to make your decision about the sample sizes used? Justify
please explain clearly. thank you
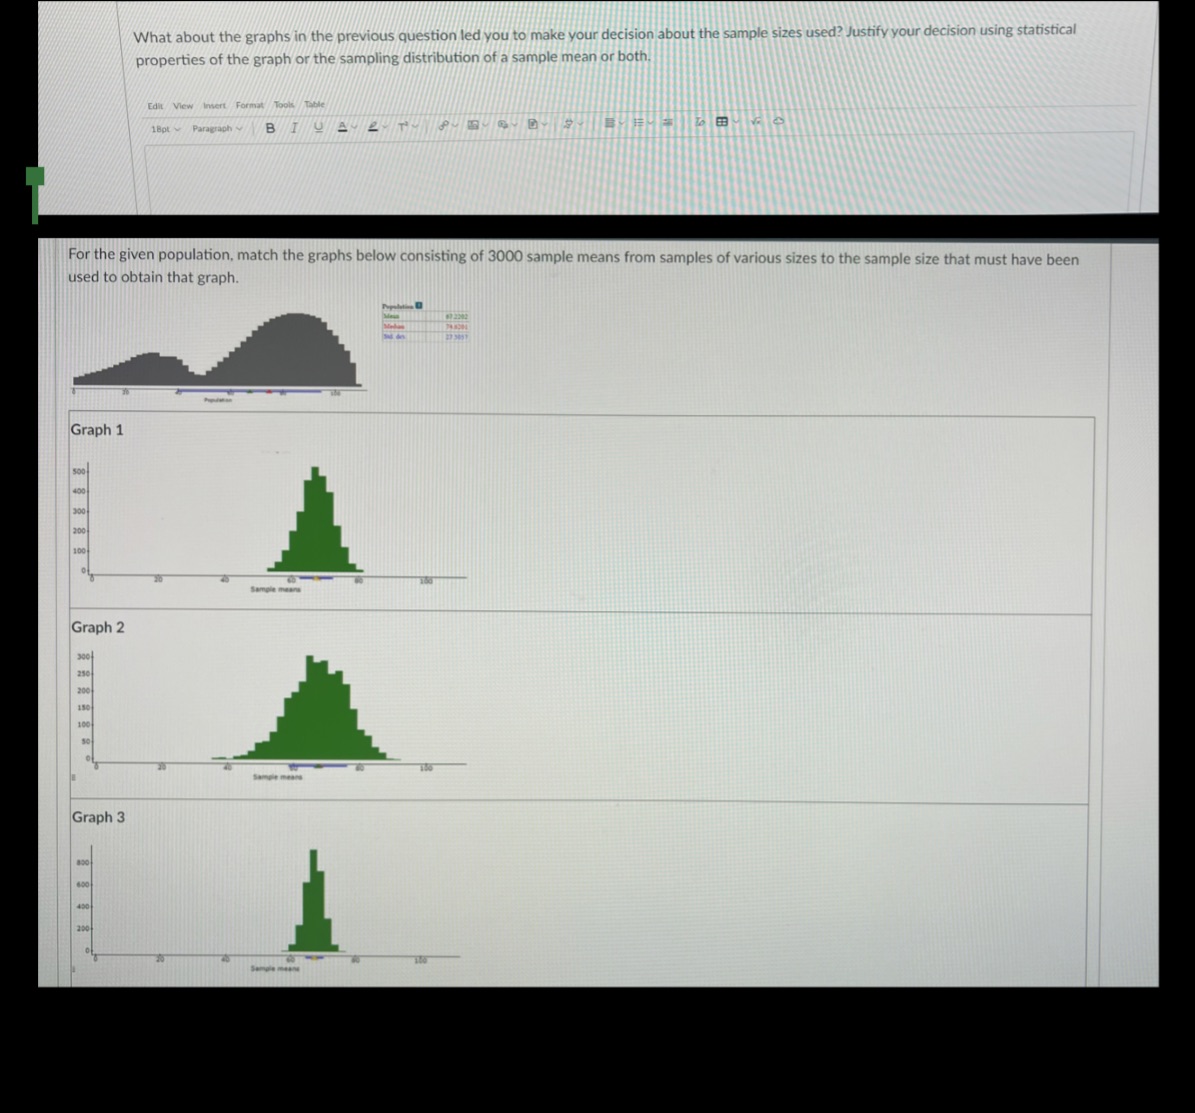
What about the graphs in the previous question led you to make your decision about the sample sizes used? Justify your decision using statistical properties of the graph or the sampling distribution of a sample mean or both. Edit View Insert Format Tools Table 1Bot Paragraph B TU A 2 T 8 8 For the given population, match the graphs below consisting of 3000 sample means from samples of various sizes to the sample size that must have been used to obtain that graph. Graph 1 Sample means Graph 2 Graph 3
Step by Step Solution
There are 3 Steps involved in it
1 Expert Approved Answer
Step: 1 Unlock

Question Has Been Solved by an Expert!
Get step-by-step solutions from verified subject matter experts
Step: 2 Unlock
Step: 3 Unlock