

Question: please explain each steps on excel. Years to maturity goes upto 30 Explain each step on Excel Construct and graph the yield curve Real Risk
please explain each steps on excel. Years to maturity goes upto 30
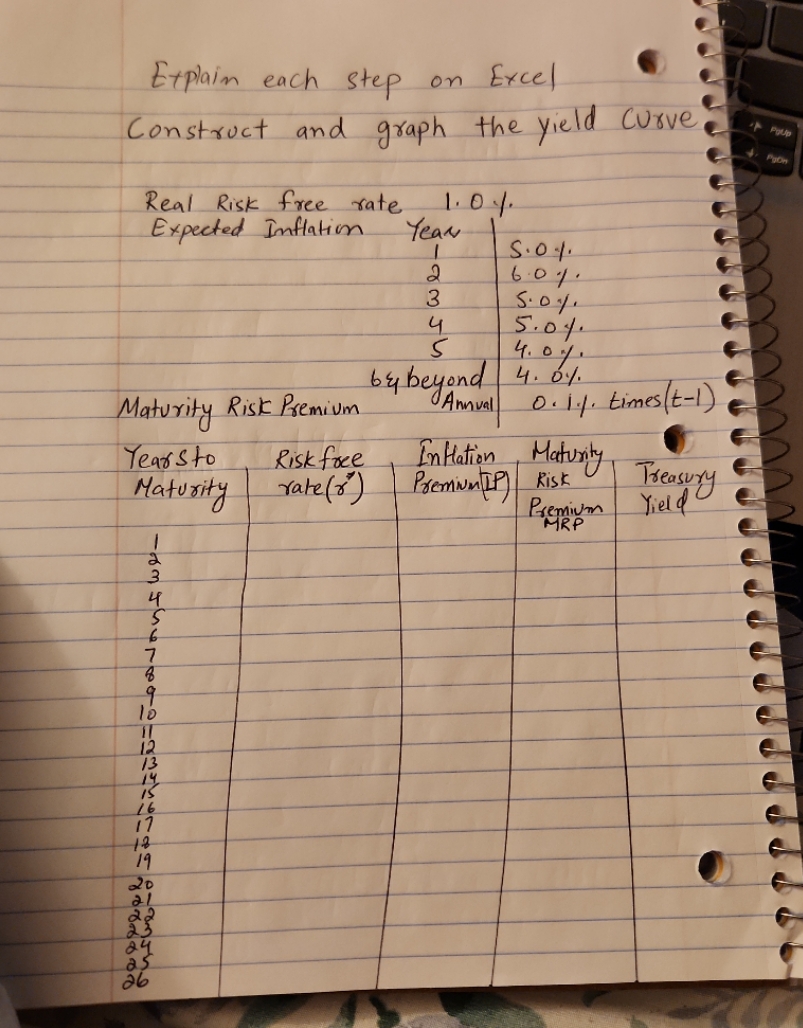 Explain each step on Excel Construct and graph the yield curve Real Risk free rate 1. 0 . Expected Inflation Year S . 0 of . 2 60 1% . 3 5. 0 1/ 1 5.04. 4. 0 of , by beyond 4. 0. Maturity Risk Premium Annual |0 . 1 .1 . times ( t-1 ) Yearsto Risk foce Entation Maturity Maturity rate ( 8 ) Premium(P ) Risk Treasury Premium Yield MRP
Step by Step Solution
There are 3 Steps involved in it
1 Expert Approved Answer
Step: 1 Unlock

Question Has Been Solved by an Expert!
Get step-by-step solutions from verified subject matter experts
Step: 2 Unlock
Step: 3 Unlock