

Question: please explain how the answer was gotten thank you. P13-4 Computing Ratios and Comparing Alternative Investment Opportunities LO 13-3, 13-4, 13-5, 13-6, 13-7 The current
please explain how the answer was gotten thank you.
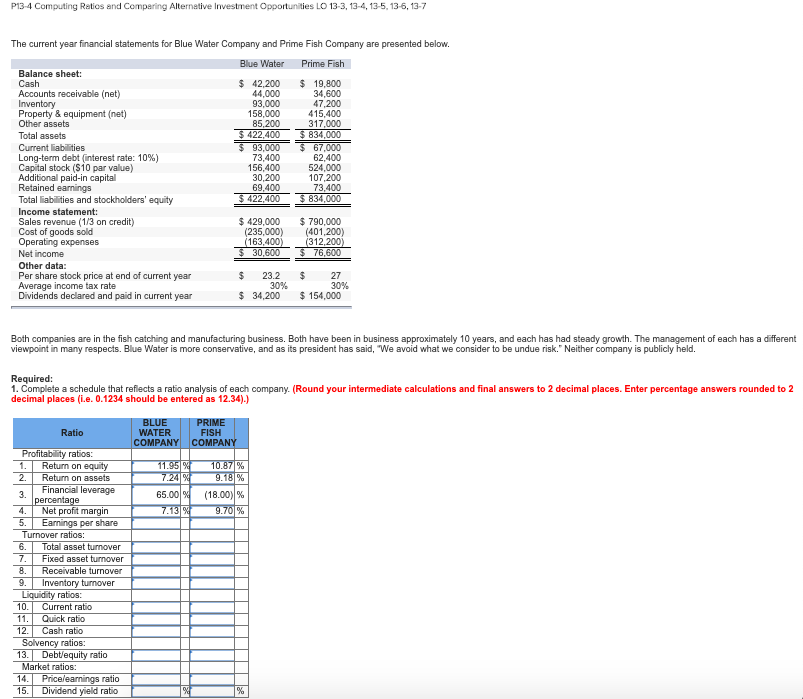
P13-4 Computing Ratios and Comparing Alternative Investment Opportunities LO 13-3, 13-4, 13-5, 13-6, 13-7 The current year financial statements for Blue Water Company and Prime Fish Company are presented below. Blue Water Prime Fish Balance sheet Cash Accounts receivable (net) Inventory Property & equipment (net) Other assets Total assets Current liabil ties Long-term debt (interest rate: 10%) Capital stock (S10 par value) Additional paid-in capital Retained earnings Total iabilities and stockholders' equity Income statement: Sales revenue (1/3 on credit) Cost of goods sold Operating expenses Net income Other data: Per share stock price at end of current year 23.2 Average income tax rate Dividends declared and paid in current year 42,200 19,800 34,600 47,200 415,400 317,000 44,000 93,000 158,000 85,200 93,000 67,000 73,400 156,400 30,200 69,400 524,000 107,200 73,400 $ 429,000 790,000 (235,000)401,200) 163,400 (312,200) 76,600 30,600 $ 34,200 154,000 30% 30% Both companies are in the fish catching and manufacturing business. Both have been in business approximately 10 years, and each has had steady growth. The management of each has a different viewpont in many respects. Blue Water is more conservative, and as its president has said, "We avoid what we consider to be undue risk." Neither company is publicly held. Required 1. Complete a schedule that reflects a ratio analysis of each company. (Round your intermediate calculations and final answers to 2 decimal places. Enter percentage answers rounded to 2 decimal places (i.e. 0.1234 should be entered as 12.34). Ratio WATER OMPA FISH COM Profitability ratios Return on equity 2. Return on assets Financial leverage 65.00194 (18.001% 3. percentage 4. Net profit margin per share urnover ratios 6. Total asset turnover 7. Fixed asset turnover 8. Receivable turnover 9. Inventory turnover Liquidity ratios 10Current ratio 11. Quick ratio 12. Cash ratio Solvency ratios: 13. Debtequity ratio Market ratios: 14. Pricelearnings ratio
Step by Step Solution
There are 3 Steps involved in it

Get step-by-step solutions from verified subject matter experts