

Question: please explain how they got these answers Homework: Chapter 4 Homework Save Score: 0 of 15 pts 6 of 6 (6 complete) HW Score: 80.39%,
please explain how they got these answers
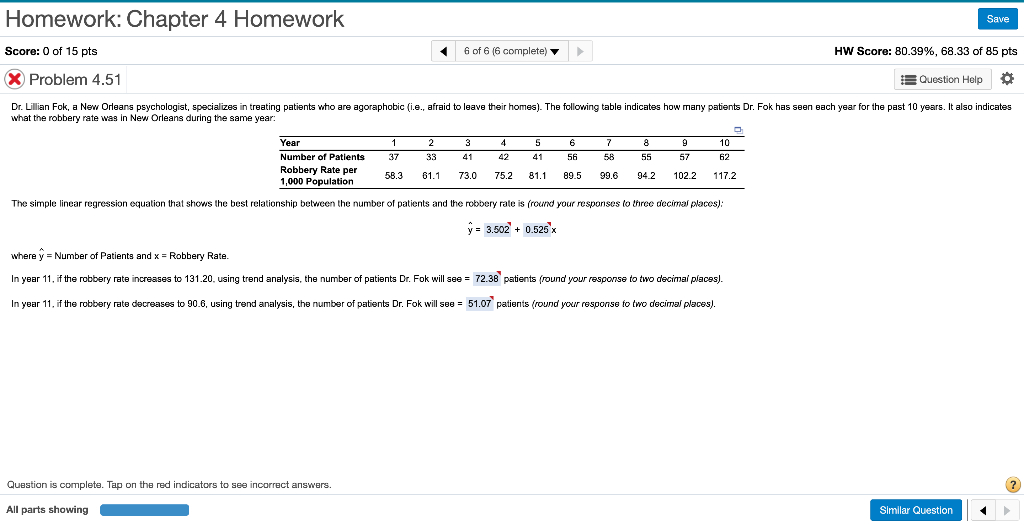
Homework: Chapter 4 Homework Save Score: 0 of 15 pts 6 of 6 (6 complete) HW Score: 80.39%, 68.33 of 85 pts X Problem 4.51 Question Help Dr. Lillian Fok, a New Orleans psychologist, specializes in treating patients who are agoraphobic (i.e., afraid to leave their homes). The following table indicates how many patients Dr. Fok has seen each year for the past 10 years. It also indicates what the robbery rate was in New Orleans during the same year: 3 4 9 1 37 2 33 5 41 6 56 7 58 8 55 10 62 41 42 57 Year Number of Patients Robbery Rate per 1,000 Population 58.3 61.1 73.0 75.2 81.1 89.5 99.6 942 102.2 117.2 The simple linear regression equation that shows the best relationship between the number of patients and the robbery rate is (round your responses to three decimal places): y = 3.502 + 0.525 where y = Number of Patients and x = Robbery Rate In year 11, if the robbery rate increases to 131.20. using trend analysis, the number of patients Dr. Fok will see = 72.38 patients (round your response to two decimal places). In year 11, if the robbery rate decreases to 90.6, using trend analysis, the number of patients Dr. Fok will see = 51.07 patients (round your response to two decimal places). Question is complete. Tap on the red indicators to see incorrect answers. ? All parts showing SimilarStep by Step Solution
There are 3 Steps involved in it
1 Expert Approved Answer
Step: 1 Unlock

Question Has Been Solved by an Expert!
Get step-by-step solutions from verified subject matter experts
Step: 2 Unlock
Step: 3 Unlock