

Question: Please explain how this graph was obtained , thanks a lot! :2 E 33. E E 4:. U1 1 75 200 1.----- Economic prot (if/wk)

Please explain how this graph was obtained , thanks a lot!
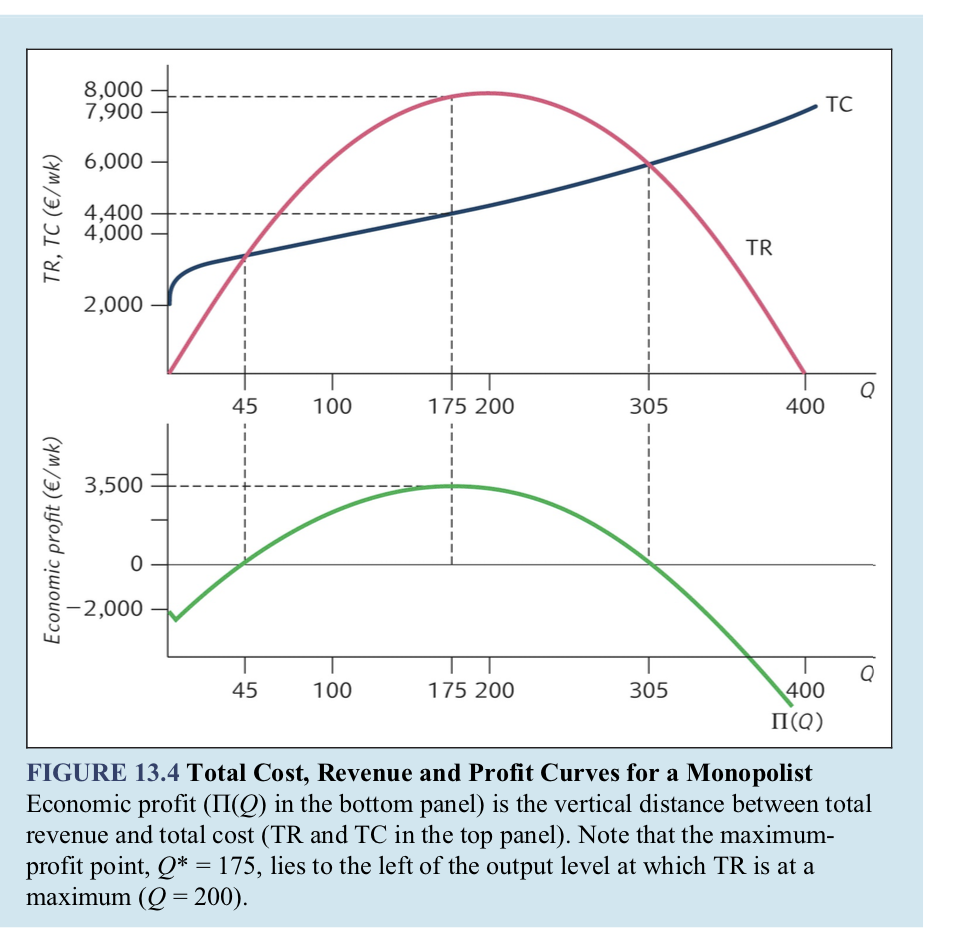
:2 E 33. E E 4:. U1 1 75 200 1.----- Economic prot (if/wk) 1 75 200 FIGURE 13.4 Total Cost, Revenue and Prot Curves for a Monopolist Economic prot (H(Q) in the bottom panel) is the vertical distance between total revenue and total cost (TR and TC in the top panel). Note that the maximum- prot point, Q\" = 175, lies to the left of the output level at which TR is at a maximum (Q = 200)
Step by Step Solution
There are 3 Steps involved in it
1 Expert Approved Answer
Step: 1 Unlock

Question Has Been Solved by an Expert!
Get step-by-step solutions from verified subject matter experts
Step: 2 Unlock
Step: 3 Unlock