

Question: Please explain how to do these b. Use the rounded summary statistics below to find the equation for the regression line: Average SD ACT 27
Please explain how to do these
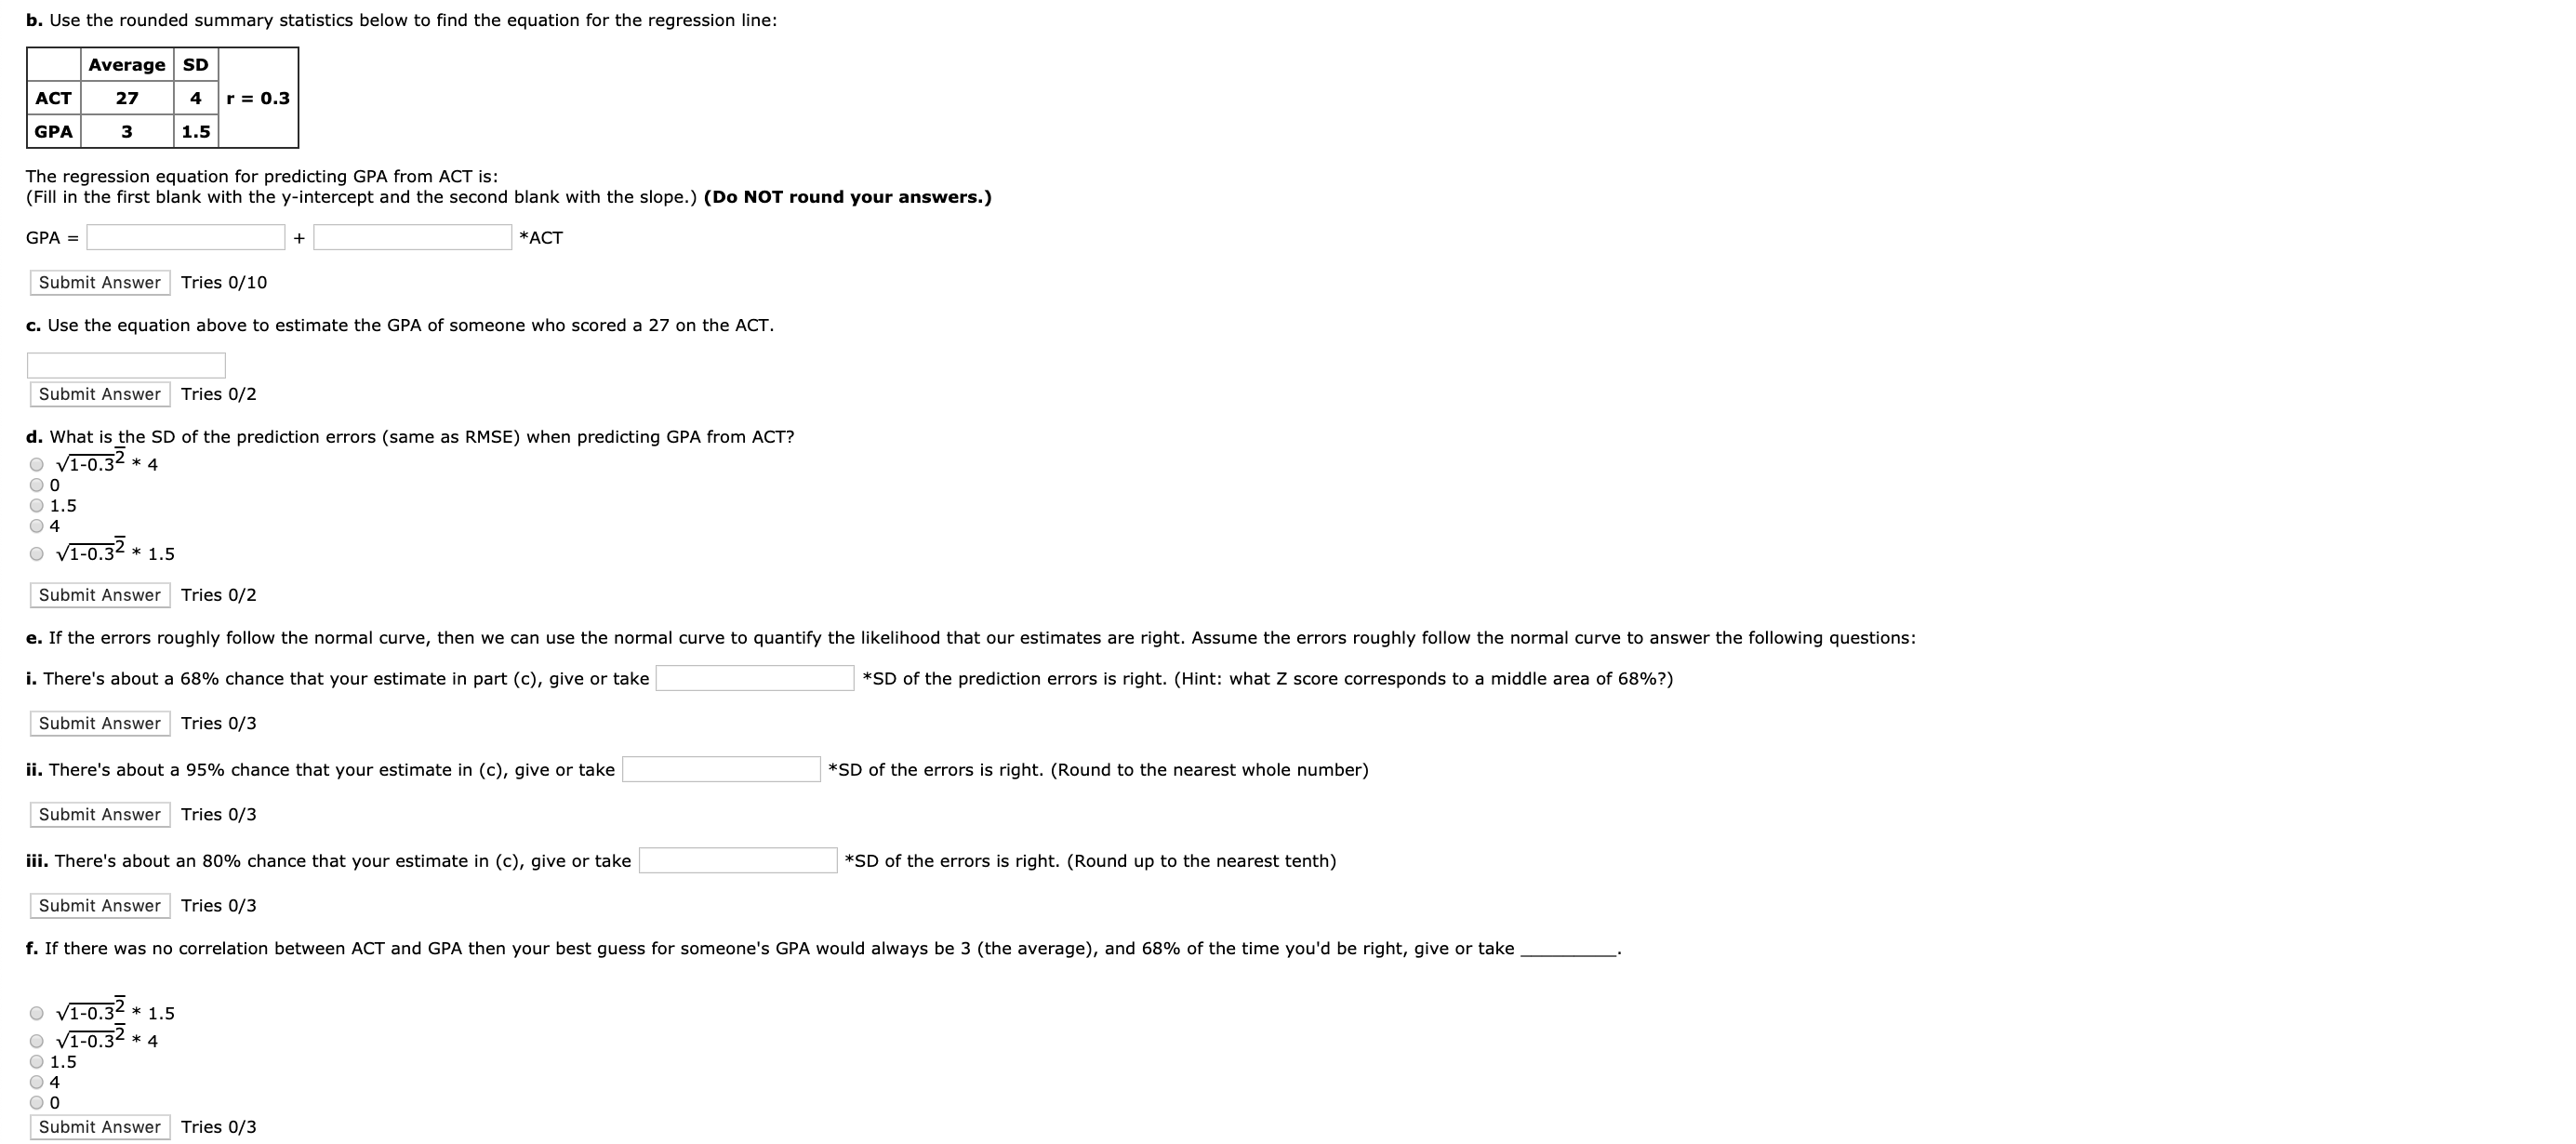
b. Use the rounded summary statistics below to find the equation for the regression line: Average SD ACT 27 4 r = 0.3 GPA 3 1.5 The regression equation for predicting GPA from ACT is: (Fill in the first blank with the y-intercept and the second blank with the slope.) (Do NOT round your answers.) GPA = *ACT Submit Answer |Tries 0/10 c. Use the equation above to estimate the GPA of someone who scored a 27 on the ACT. Submit Answer Tries 0/2 d. What is the SD of the prediction errors (same as RMSE) when predicting GPA from ACT? O V1-0.32* 4 0 0 O 1.5 0 4 O V1-0.32 * 1.5 Submit Answer Tries 0/2 e. If the errors roughly follow the normal curve, then we can use the normal curve to quantify the likelihood that our estimates are right. Assume the errors roughly follow the normal curve to answer the following questions: i. There's about a 68% chance that your estimate in part (c), give or take *SD of the prediction errors is right. (Hint: what Z score corresponds to a middle area of 68%?) Submit Answer| Tries 0/3 ii. There's about a 95% chance that your estimate in (c), give or take *SD of the errors is right. (Round to the nearest whole number) Submit Answer|Tries 0/3 iii. There's about an 80% chance that your estimate in (c), give or take *SD of the errors is right. (Round up to the nearest tenth) Submit Answer Tries 0/3 f. If there was no correlation between ACT and GPA then your best guess for someone's GPA would always be 3 (the average), and 68% of the time you'd be right, give or take O V1-0.32 * 1.5 O V1-0.32 * 4 O 1.5 20 Submit Answer Tries 0/3
Step by Step Solution
There are 3 Steps involved in it

Get step-by-step solutions from verified subject matter experts