

Question: Please explain how to find the confidence interval. I do not have access to Megastat. Multiple Regression, Confidence Intervals, Reliability of Cost Formulas Randy Harris,
Please explain how to find the confidence interval. I do not have access to Megastat.
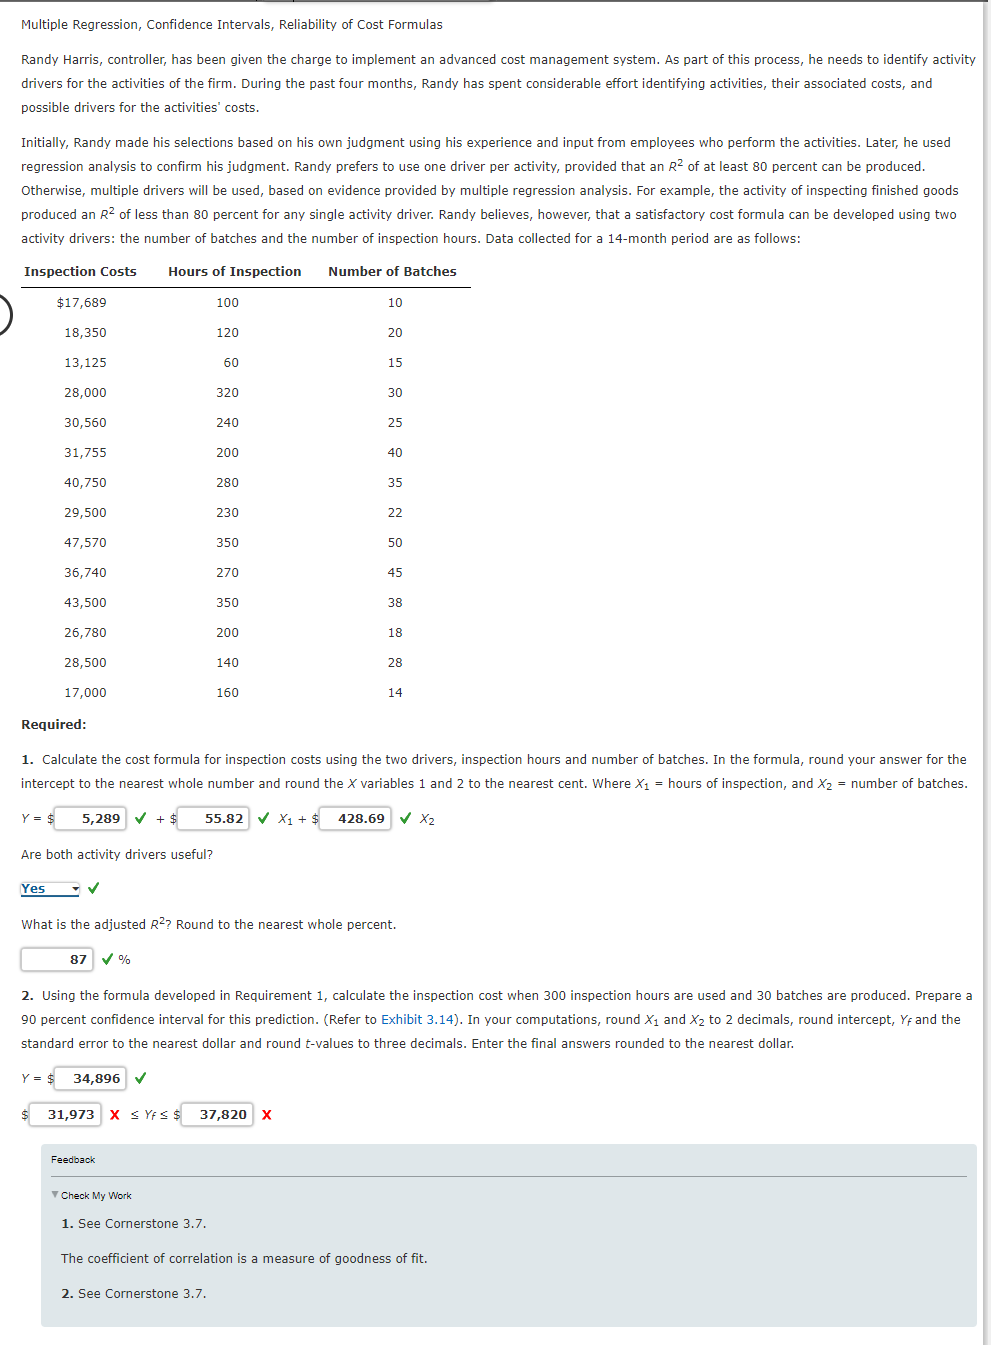
Multiple Regression, Confidence Intervals, Reliability of Cost Formulas Randy Harris, controller, has been given the charge to implement an advanced cost management system. As part of this process, he needs to identify activity drivers for the activities of the firm. During the past four months, Randy has spent considerable effort identifying activities, their associated costs, and possible drivers for the activities' costs. Initially, Randy made his selections based on his own judgment using his experience and input from employees who perform the activities. Later, he used regression analysis to confirm his judgment. Randy prefers to use one driver per activity, provided that an R2 of at least 80 percent can be produced. Otherwise, multiple drivers will be used, based on evidence provided by multiple regression analysis. For example, the activity of inspecting finished goods produced an R2 of less than 80 percent for any single activity driver. Randy believes, however, that a satisfactory cost formula can be developed using two activity drivers: the number of batches and the number of inspection hours. Data collected for a 14-month period are as follows: Kequired: 1. Calculate the cost formula for inspection costs using the two drivers, inspection hours and number of batches. In the formula, round your answer for the intercept to the nearest whole number and round the X variables 1 and 2 to the nearest cent. Where X1= hours of inspection, and X2= number of batches. Y=+X1+X2 Are both activity drivers useful? What is the adjusted R2 ? Round to the nearest whole percent. 2 2. Using the formula developed in Requirement 1 , calculate the inspection cost when 300 inspection hours are used and 30 batches are produced. Prepare a 90 percent confidence interval for this prediction. (Refer to Exhibit 3.14). In your computations, round X1 and X2 to 2 decimals, round intercept, Yf and the standard error to the nearest dollar and round t-values to three decimals. Enter the final answers rounded to the nearest dollar. Y=s 9 XYfX Feedback Check My Work 1. See Cornerstone 3.7 . The coefficient of correlation is a measure of goodness of fit. 2. See Cornerstone 3.7
Step by Step Solution
There are 3 Steps involved in it

Get step-by-step solutions from verified subject matter experts