

Question: PLEASE EXPLAIN HOW TO GET THE ABS PERCENTAGE DEVIATION IN EXCEL AND SHOW FORMULAS correct answer = like guaranteed A B C D E F
PLEASE EXPLAIN HOW TO GET THE ABS PERCENTAGE DEVIATION IN EXCEL AND SHOW FORMULAS
correct answer = like guaranteed
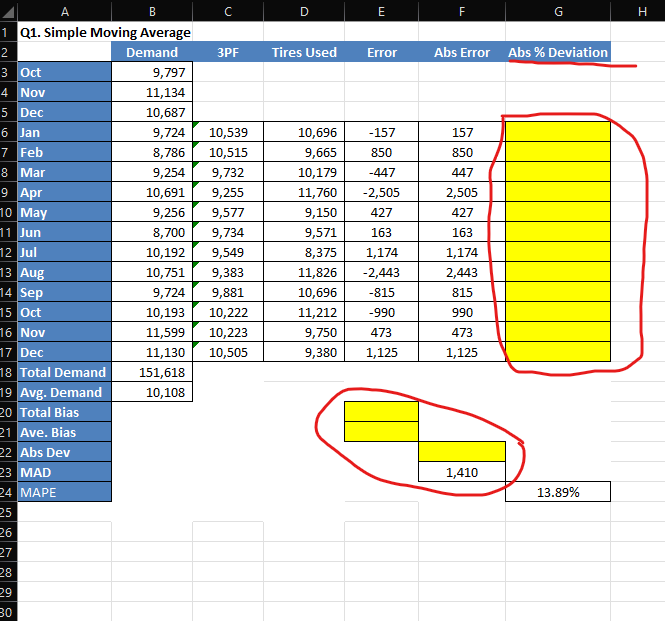
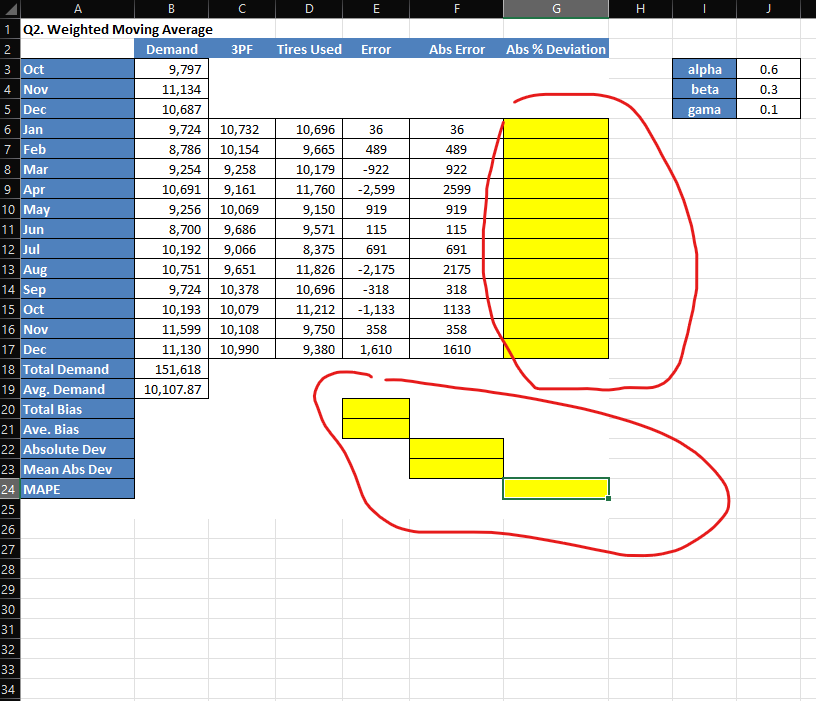
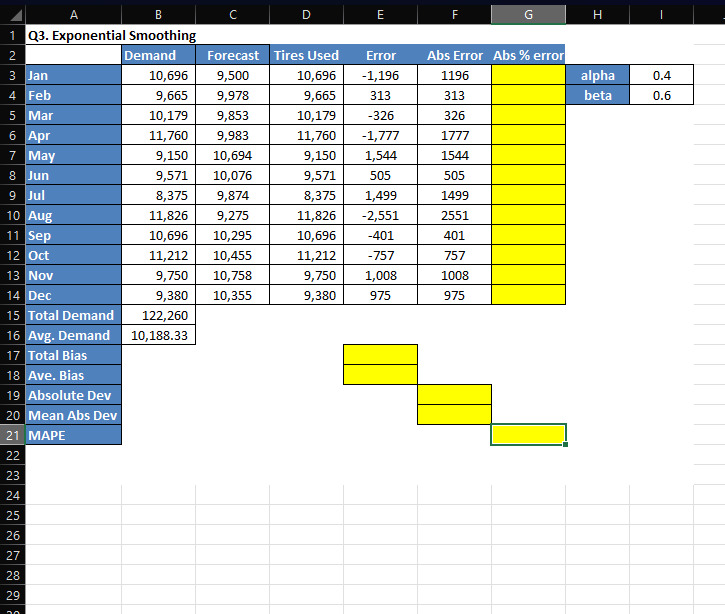
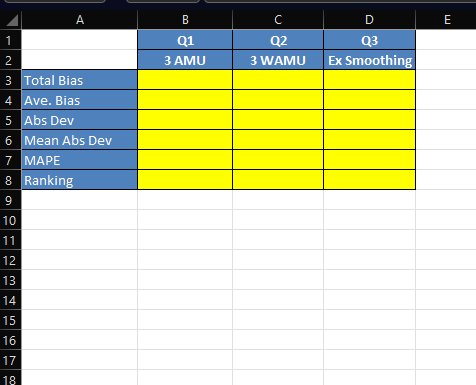
A B C D E F G H Q1. Simple Moving Average \begin{tabular}{|l|r|} \hline & Demand \\ \hline Oct & 9,797 \\ \hline Nov & 11,134 \\ \hline Dec & 10,687 \\ \hline Jan & 9,724 \\ \hline Feb & 8,786 \\ \hline Mar & 9,254 \\ \hline Apr & 10,691 \\ \hline May & 9,256 \\ \hline Jun & 8,700 \\ \hline Jul & 10,192 \\ \hline Aug & 10,751 \\ \hline Sep & 9,724 \\ \hline Oct & 10,193 \\ \hline Nov & 11,599 \\ \hline Dec & 11,130 \\ \hline Total Demand & 151,618 \\ \hline Avg. Demand & 10,108 \\ \hline \end{tabular} 3PF Tires Used Error Abs Error Abs \% Deviation Total Bias Ave. Bias Abs Dev MAD \begin{tabular}{|c|c|c|c|c|c|} \hline & A & B & C & D & E \\ \hline 1 & & Q1 & Q2 & Q3 & \\ \hline 2 & & 3 AMU & 3 WAMU & Ex Smoothing & \\ \hline 3 & Total Bias & & & & \\ \hline 4 & Ave. Bias & & & & \\ \hline 5 & Abs Dev & & & & \\ \hline 6 & Mean Abs Dev & & & & \\ \hline 7 & MAPE & & & & \\ \hline 8 & Ranking & & & & \\ \hline 9 & & & & & \\ \hline 10 & & & & & \\ \hline 11 & & & & & \\ \hline 12 & & & & & \\ \hline 13 & & & & & \\ \hline 14 & & & & & \\ \hline 15 & & & & & \\ \hline 16 & & & & & \\ \hline 17 & & & & & \\ \hline \end{tabular} 4 A B C D G H I 1 Q3. Exponential Smoothing \begin{tabular}{|c|c|c|c|c|c|c|c|c|} \hline 2 & Demand & Forecast & Tires Used & Error & Abs Error & Abs \% error & & \\ \hline 3 Jan & 10,696 & 9,500 & 10,696 & 1,196 & 1196 & & alpha & 0.4 \\ \hline 4 Feb & 9,665 & 9,978 & 9,665 & 313 & 313 & & beta & 0.6 \\ \hline 5 Mar & 10,179 & 9,853 & 10,179 & -326 & 326 & & & \\ \hline 6Apr & 11,760 & 9,983 & 11,760 & 1,777 & 1777 & & & \\ \hline 7 May & 9,150 & 10,694 & 9,150 & 1,544 & 1544 & & & \\ \hline 8 Jun & 9,571 & 10,076 & 9,571 & 505 & 505 & & & \\ \hline 9 Jul & 8,375 & 9,874 & 8,375 & 1,499 & 1499 & & & \\ \hline 10 Aug & 11,826 & 9,275 & 11,826 & 2,551 & 2551 & & & \\ \hline 11 Sep & 10,696 & 10,295 & 10,696 & -401 & 401 & & & \\ \hline 12 Oct & 11,212 & 10,455 & 11,212 & -757 & 757 & & & \\ \hline 13 Nov & 9,750 & 10,758 & 9,750 & 1,008 & 1008 & & & \\ \hline 14 Dec & 9,380 & 10,355 & 9,380 & 975 & 975 & & & \\ \hline 15 Total Demand & 122,260 & & & & & & & \\ \hline 16 Avg. Demand & 10,188.33 & & & & & & & \\ \hline 17 Total Bias & & & & & & & & \\ \hline 18 Ave. Bias & & & & & & & & \\ \hline 19 Absolute Dev & & & & & & & & \\ \hline 20 Mean Abs Dev & & & & & & & & \\ \hline 21 MAPE & & & & & & & & \\ \hline \end{tabular} A B C Q2. Weighted Moving Average
Step by Step Solution
There are 3 Steps involved in it

Get step-by-step solutions from verified subject matter experts