

Question: please explain how to observe in the chart. Consider the following two regression lines for stocks A and B in the following figure. Which stock
please explain how to observe in the chart.
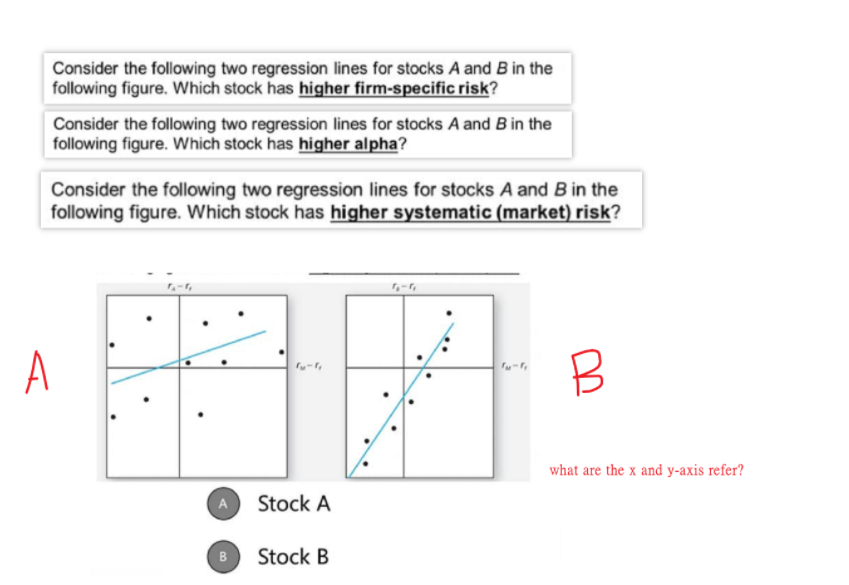
Consider the following two regression lines for stocks A and B in the following figure. Which stock has higher firm-specific risk? Consider the following two regression lines for stocks A and B in the following figure. Which stock has higher alpha? Consider the following two regression lines for stocks A and B in the following figure. Which stock has higher systematic (market) risk? B what are the x and y-axis refer? Stock A B Stock B
Step by Step Solution
There are 3 Steps involved in it
1 Expert Approved Answer
Step: 1 Unlock

Question Has Been Solved by an Expert!
Get step-by-step solutions from verified subject matter experts
Step: 2 Unlock
Step: 3 Unlock