

Question: Please explain how you get to answer and how it works. (Click the icon to view the data.) Read the requirements. Requirement 1. Estimate the

 Please explain how you get to answer and how it works.
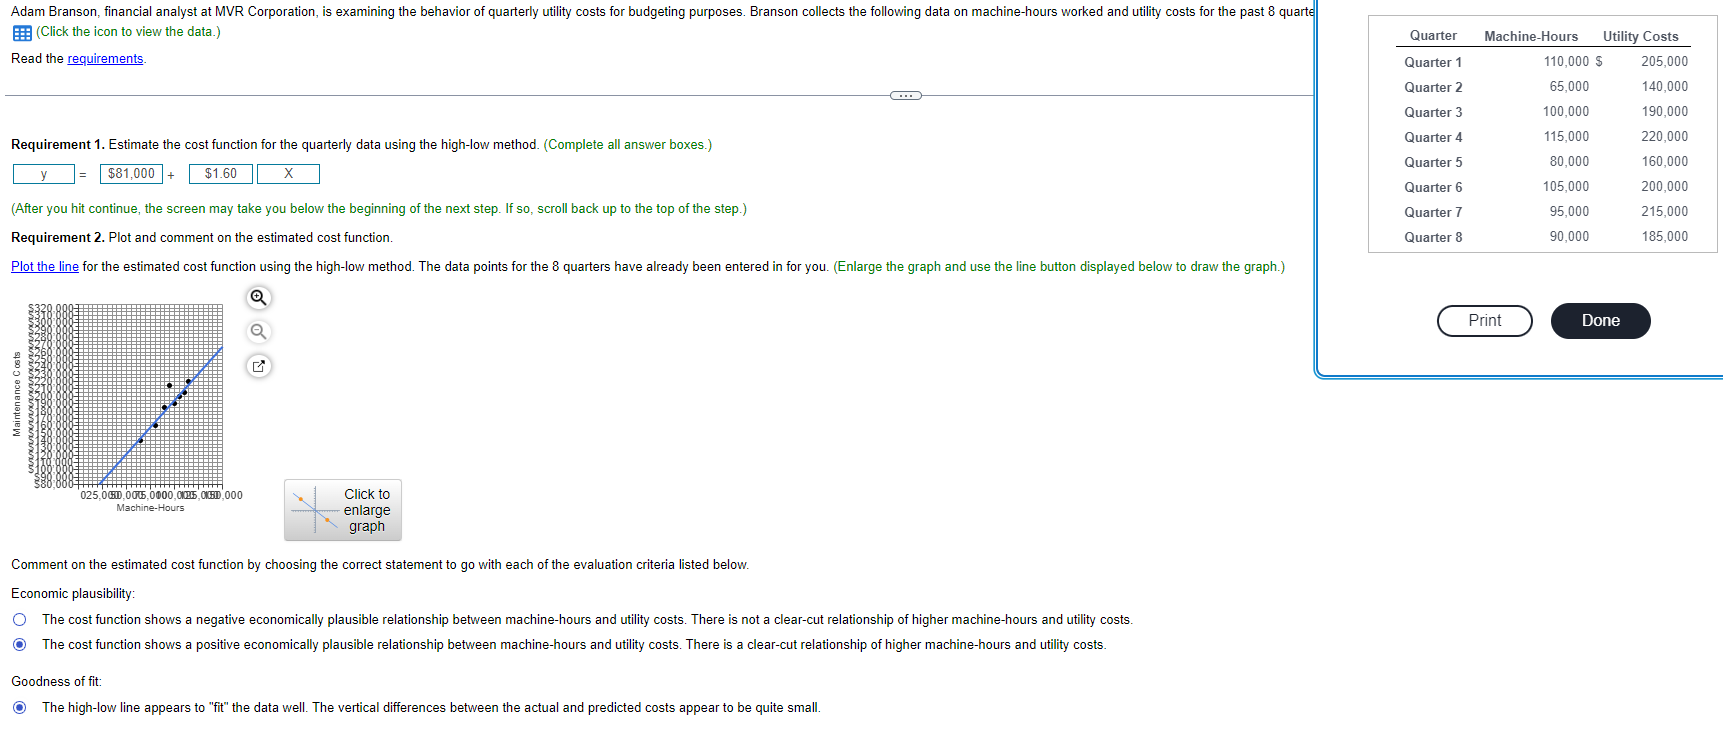
(Click the icon to view the data.) Read the requirements. Requirement 1. Estimate the cost function for the quarterly data using the high-low method. (Complete all answer boxes.) (After you hit continue, the screen may take you below the beginning of the next step. If so, scroll back up to the top of the step.) Requirement 2. Plot and comment on the estimated cost function. Comment on the estimated cost function by choosing the correct statement to go with each of the evaluation criteria listed below. Economic plausibility: The cost function shows a positive economically plausible relationship between machine-hours and utility costs. There is a clear-cut relationship of higher machine-hours and utility costs. Goodness of fit: The high-low line appears to "fit" the data well. The vertical differences between the actual and predicted costs appear to be quite small
Step by Step Solution
There are 3 Steps involved in it

Get step-by-step solutions from verified subject matter experts