

Question: please explain how you got to ur answer I'm lost and would love to understand and learn it ger 2021 vista Virtual School Math 30-1

please explain how you got to ur answer I'm lost and would love to understand and learn it
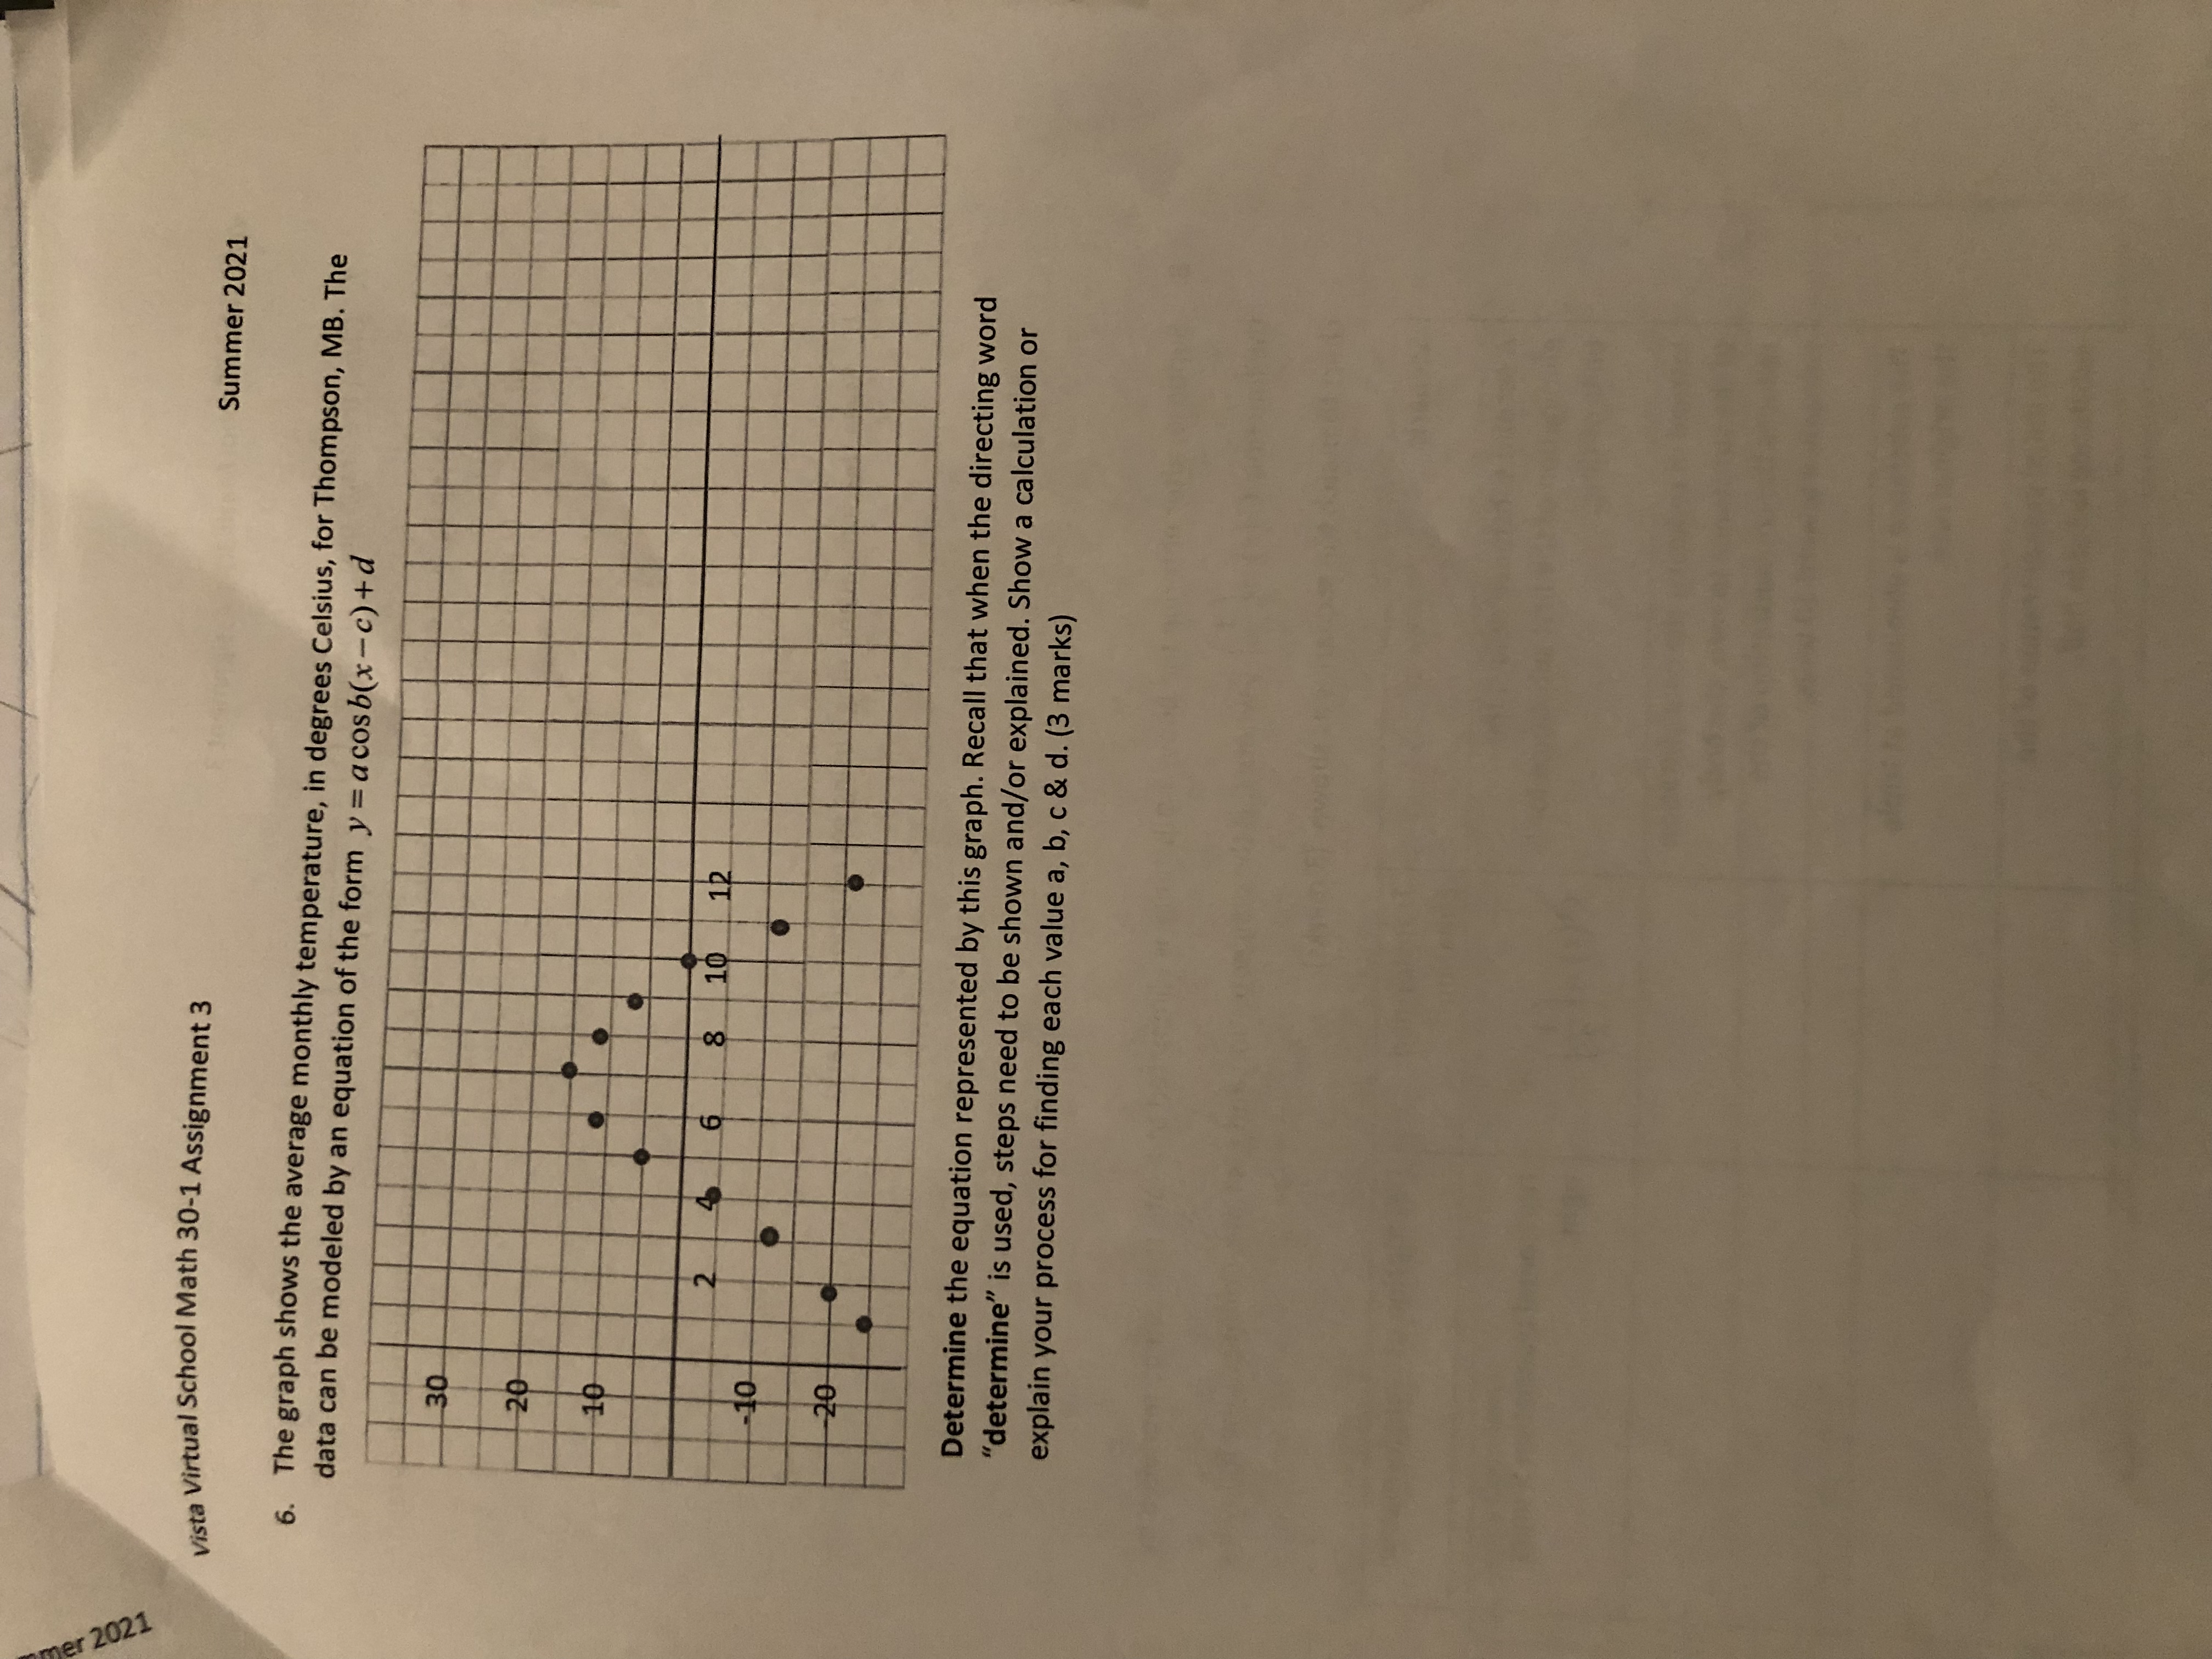
ger 2021 vista Virtual School Math 30-1 Assignment 3 Summer 2021 6. The graph shows the average monthly temperature, in degrees Celsius, for Thompson, MB. The data can be modeled by an equation of the form y = acosb(x-c) +d 30 20 10 2 4 6 8 10 12 10 20 Determine the equation represented by this graph. Recall that when the directing word "determine" is used, steps need to be shown and/or explained. Show a calculation or explain your process for finding each value a, b, c & d
Step by Step Solution
There are 3 Steps involved in it
1 Expert Approved Answer
Step: 1 Unlock

Question Has Been Solved by an Expert!
Get step-by-step solutions from verified subject matter experts
Step: 2 Unlock
Step: 3 Unlock