

Question: * PLEASE EXPLAIN HOW YOU SOLVE, BECAUSE I NEED TO UNDERSTAND IT * 1 0.9 Feed line 0.8 0.7 R.O.L 0.6 y 0.5 S.O.L 0.4
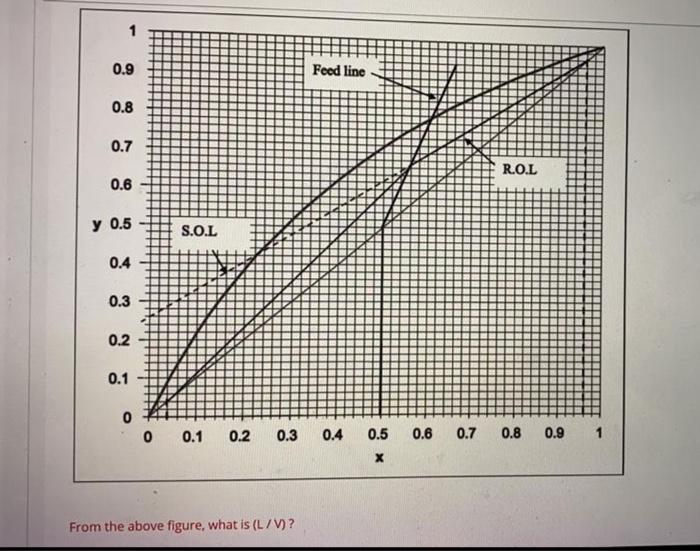
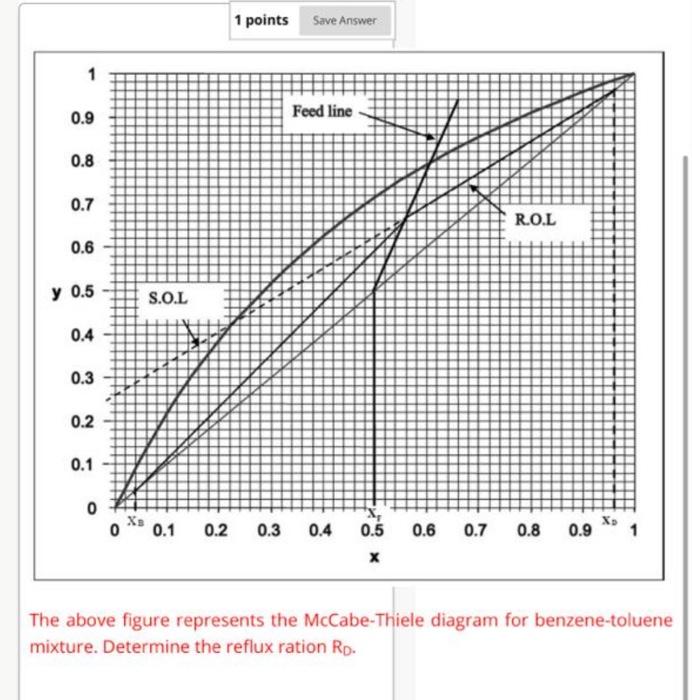
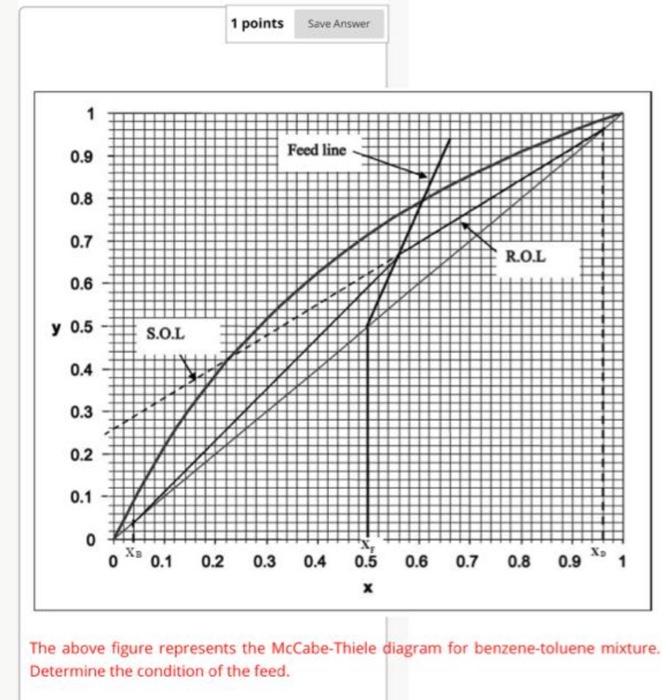
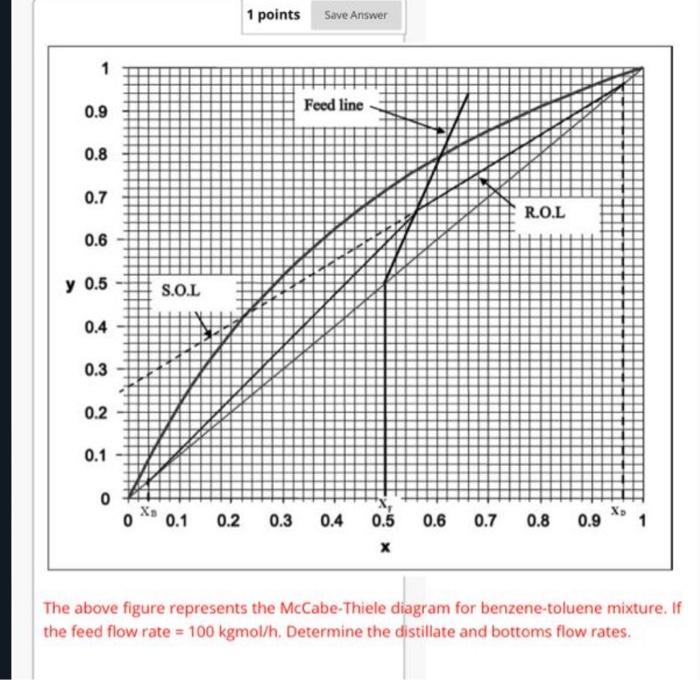
1 0.9 Feed line 0.8 0.7 R.O.L 0.6 y 0.5 S.O.L 0.4 0.3 0.2 0.1 0 0 0.1 0.2 0.3 0.4 0.5 0.6 0.7 0.8 0.9 1 From the above figure, what is (L/V)? 1 points Save Answer 1 Feed line 0.9 0.8 0.7 R.O.L 0.6 0.5 S.O.L 0.4 0.3 0.2 0.1 0 0 Xs 0.1 X 0.2 0.3 0.4 0.5 0.6 0.7 0.8 0.9 The above figure represents the McCabe-Thiele diagram for benzene-toluene mixture. Determine the reflux ration Rp. 1 points Save Answer 1 0.9 Feed line 0.8 0.7 R.O.L 0.6 y 0.5 S.O.L 0.4 0.3 0.2 0.1 0 0 Xs X 0.1 0.2 0.3 0.4 0.5 0.6 0.7 0.8 0.9 1 The above figure represents the McCabe-Thiele diagram for benzene-toluene mixture. Determine the condition of the feed. 1 points Save Answer 1 0.9 Feed line 0.8 0.7 R.O.L 0.6 0.5 S.O.L 0.4 0.3 0.2 0.1 0 0 X3 0.1 XD 0.2 0.3 0.4 0.5 0.6 0.7 0.8 0.9 1 The above figure represents the McCabe-Thiele diagram for benzene-toluene mixture. If the feed flow rate = 100 kgmol/h. Determine the distillate and bottoms flow rates
Step by Step Solution
There are 3 Steps involved in it

Get step-by-step solutions from verified subject matter experts