

Question: Please explain in detail without excel. I do not understand how to find the Standard Deviations without the correlating coefficient and without the weights of
Please explain in detail without excel. I do not understand how to find the Standard Deviations without the correlating coefficient and without the weights of each.
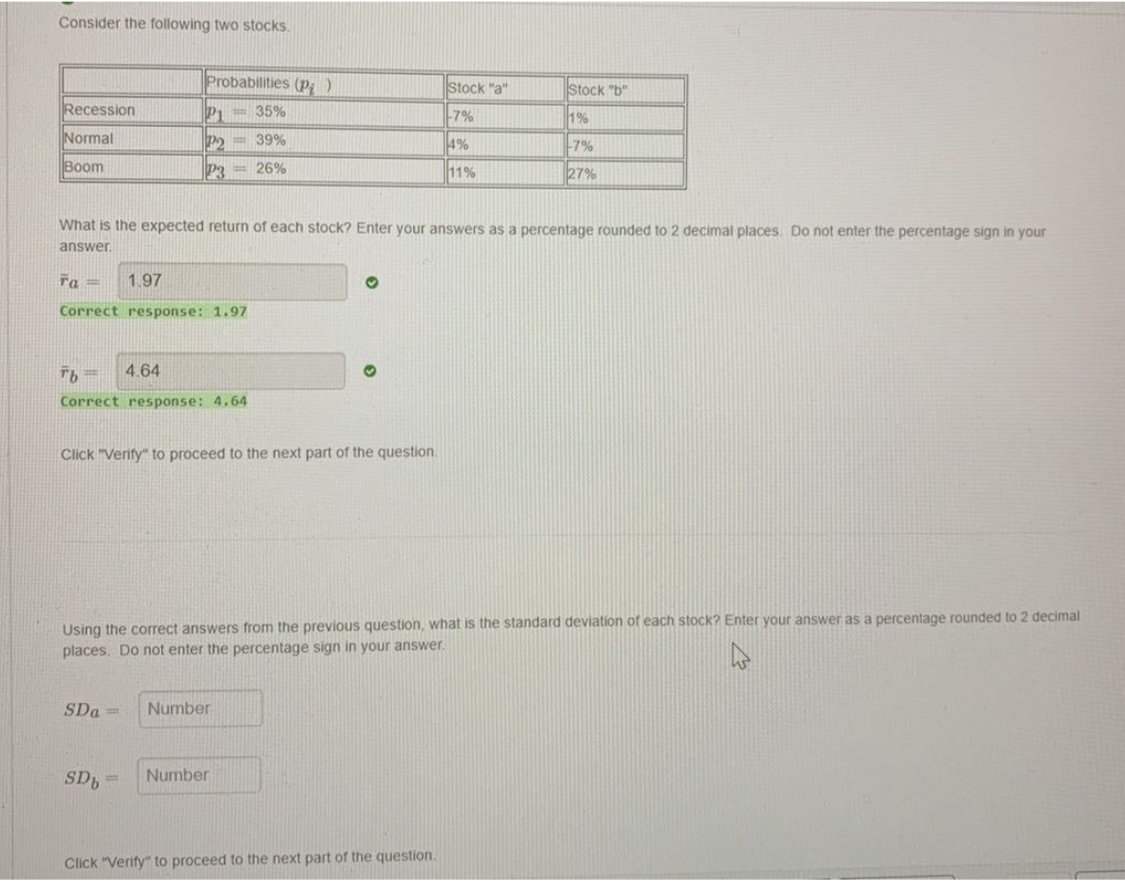
Consider the following two stocks Probabilities (P; ) Stock "a" Stock "b" Recession P1 35% 7% 1% Normal 2 39% 4% -7% Boom P3 - 26% 11% 27% What is the expected return of each stock? Enter your answers as a percentage rounded to 2 decimal places. Do not enter the percentage sign in your answer. 1.97 Correct response: 1.97 Tb 4.64 Correct response: 4.64 Click "Verify" to proceed to the next part of the question. Using the correct answers from the previous question, what is the standard deviation of each stock? Enter your answer as a percentage rounded to 2 decimal places. Do not enter the percentage sign in your answer. SDa= Number SDb Number Click "Verify" to proceed to the next part of the
Step by Step Solution
There are 3 Steps involved in it

Get step-by-step solutions from verified subject matter experts