

Question: Please explain me about the Minimum Variance Portfolio. What are those numbers in the picture coming from? Two Risky Assets: Example TABLE 7.3 Wo WE
Please explain me about the Minimum Variance Portfolio. What are those numbers in the picture coming from?
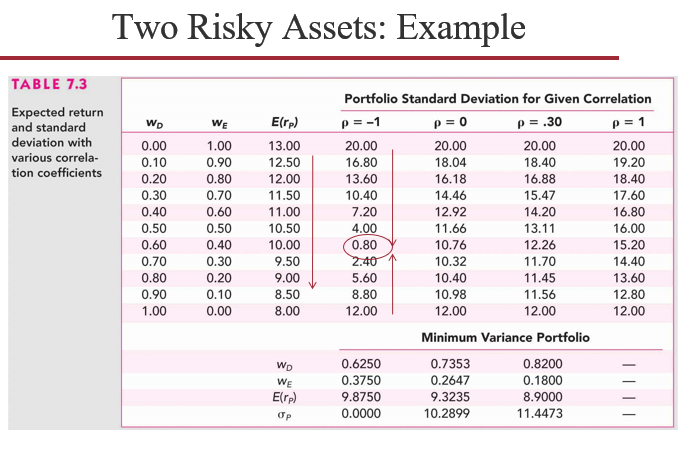
Two Risky Assets: Example TABLE 7.3 Wo WE Erp) Expected return and standard deviation with various correla- tion coefficients 0.00 0.10 0.20 0.30 0.40 0.50 0.60 0.70 0.80 0.90 1.00 1.00 0.90 0.80 0.70 0.60 0.50 0.40 0.30 0.20 0.10 0.00 13.00 12.50 12.00 11.50 11.00 10.50 10.00 9.50 9.00 8.50 8.00 Portfolio Standard Deviation for Given Correlation p = -1 p = 0 p = .30 p = 1 20.00 20.00 20.00 20.00 16.80 18.04 18.40 19.20 13.60 16.18 16.88 18.40 10.40 14.46 15.47 17.60 7.20 12.92 14.20 16.80 4.00 11.66 13.11 16.00 (0.80 10.76 12.26 15.20 2.40 10.32 11.70 14.40 5.60 10.40 11.45 13.60 8.80 10.98 11.56 12.80 12.00 12.00 12.00 12.00 Minimum Variance Portfolio 0.6250 0.7353 0.8200 0.3750 0.2647 0.1800 9.8750 9.3235 8.9000 0.0000 10.2899 11.4473 Wp WE Elrp) 190 op Two Risky Assets: Example TABLE 7.3 Wo WE Erp) Expected return and standard deviation with various correla- tion coefficients 0.00 0.10 0.20 0.30 0.40 0.50 0.60 0.70 0.80 0.90 1.00 1.00 0.90 0.80 0.70 0.60 0.50 0.40 0.30 0.20 0.10 0.00 13.00 12.50 12.00 11.50 11.00 10.50 10.00 9.50 9.00 8.50 8.00 Portfolio Standard Deviation for Given Correlation p = -1 p = 0 p = .30 p = 1 20.00 20.00 20.00 20.00 16.80 18.04 18.40 19.20 13.60 16.18 16.88 18.40 10.40 14.46 15.47 17.60 7.20 12.92 14.20 16.80 4.00 11.66 13.11 16.00 (0.80 10.76 12.26 15.20 2.40 10.32 11.70 14.40 5.60 10.40 11.45 13.60 8.80 10.98 11.56 12.80 12.00 12.00 12.00 12.00 Minimum Variance Portfolio 0.6250 0.7353 0.8200 0.3750 0.2647 0.1800 9.8750 9.3235 8.9000 0.0000 10.2899 11.4473 Wp WE Elrp) 190 op
Step by Step Solution
There are 3 Steps involved in it

Get step-by-step solutions from verified subject matter experts