

Question: please explain R chart: X bar chart: - 1 10 11 12 13 14 15 16 17 19 20 O Is R chart in control
please explain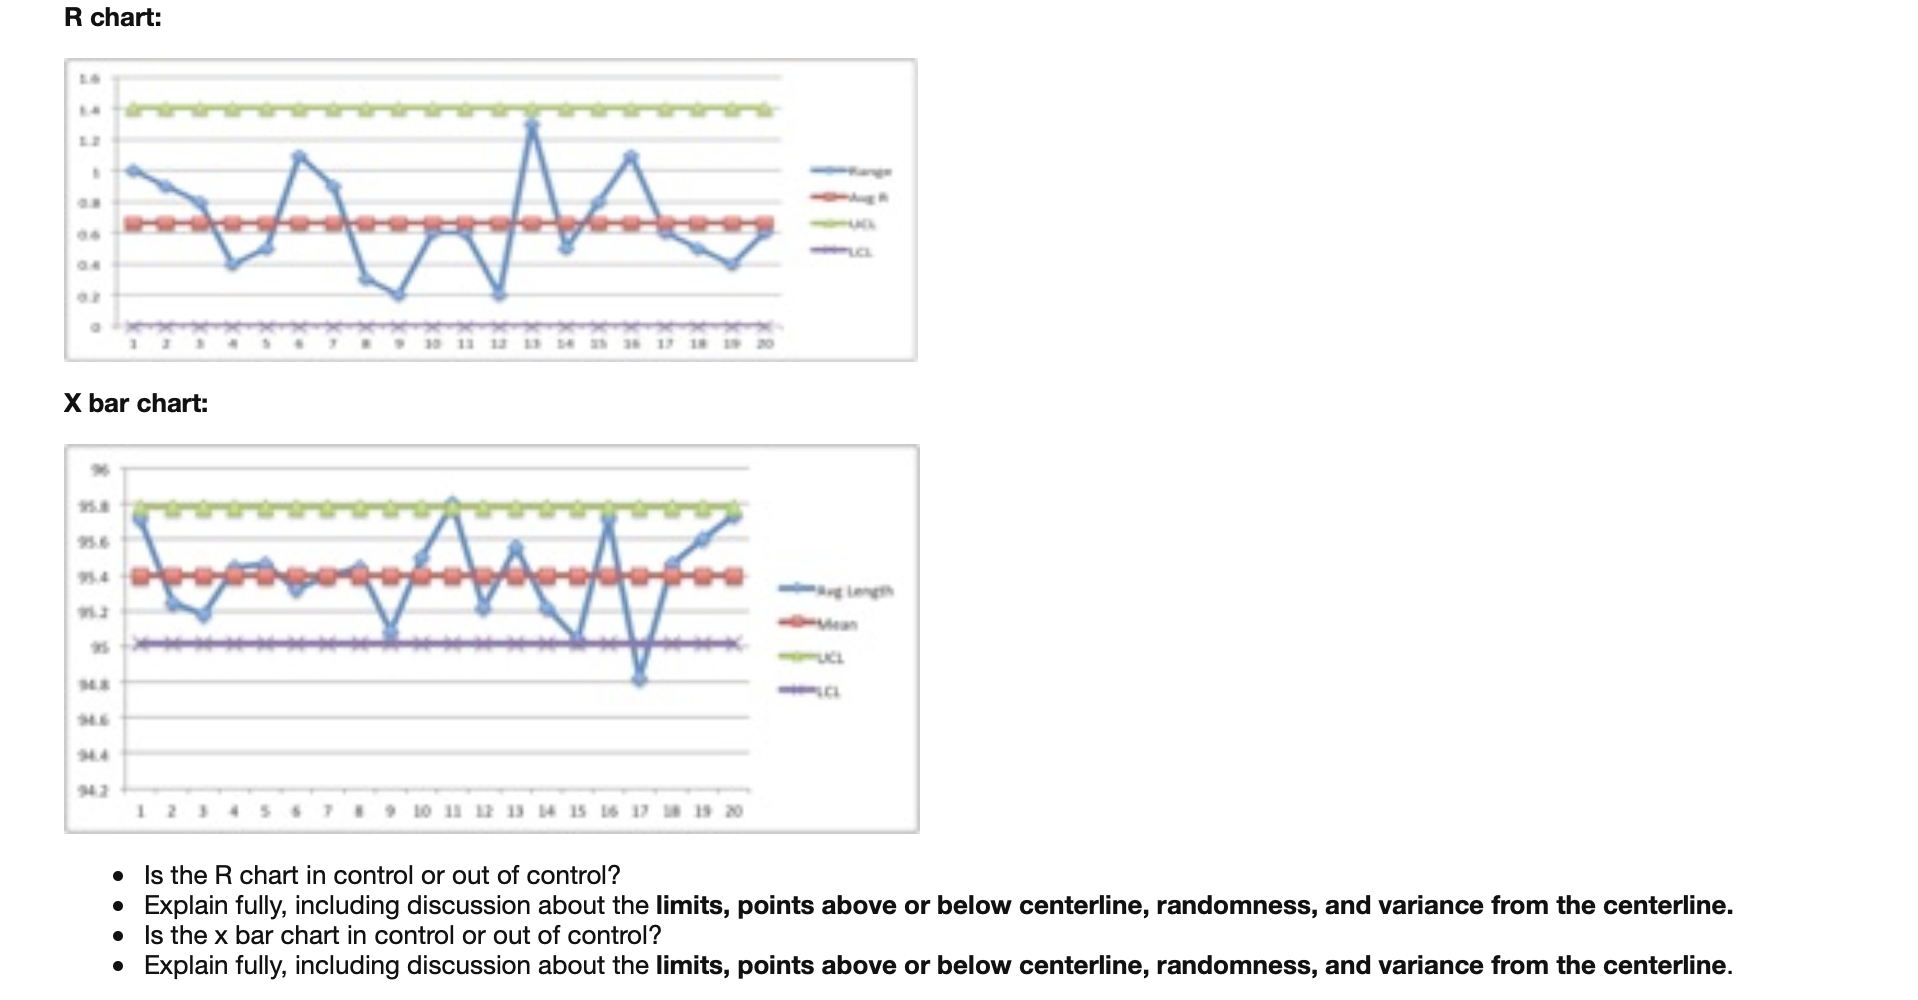
R chart: X bar chart: - 1 10 11 12 13 14 15 16 17 19 20 O Is R chart in control or out control? Explain fully, including discussion about the limits, points above or below centerline, randomness, and variance from the centerline. Is the x bar chart in control or out of control? Explain fully, including discussion about the limits, points above or below centerline, randomness, and variance from the centerline
Step by Step Solution
There are 3 Steps involved in it
1 Expert Approved Answer
Step: 1 Unlock

Question Has Been Solved by an Expert!
Get step-by-step solutions from verified subject matter experts
Step: 2 Unlock
Step: 3 Unlock