

Question: Please Explain Someone OPER1401 SQC example B Based on the following information set up a control chart that shows the process mean, upper and lower
Please Explain Someone
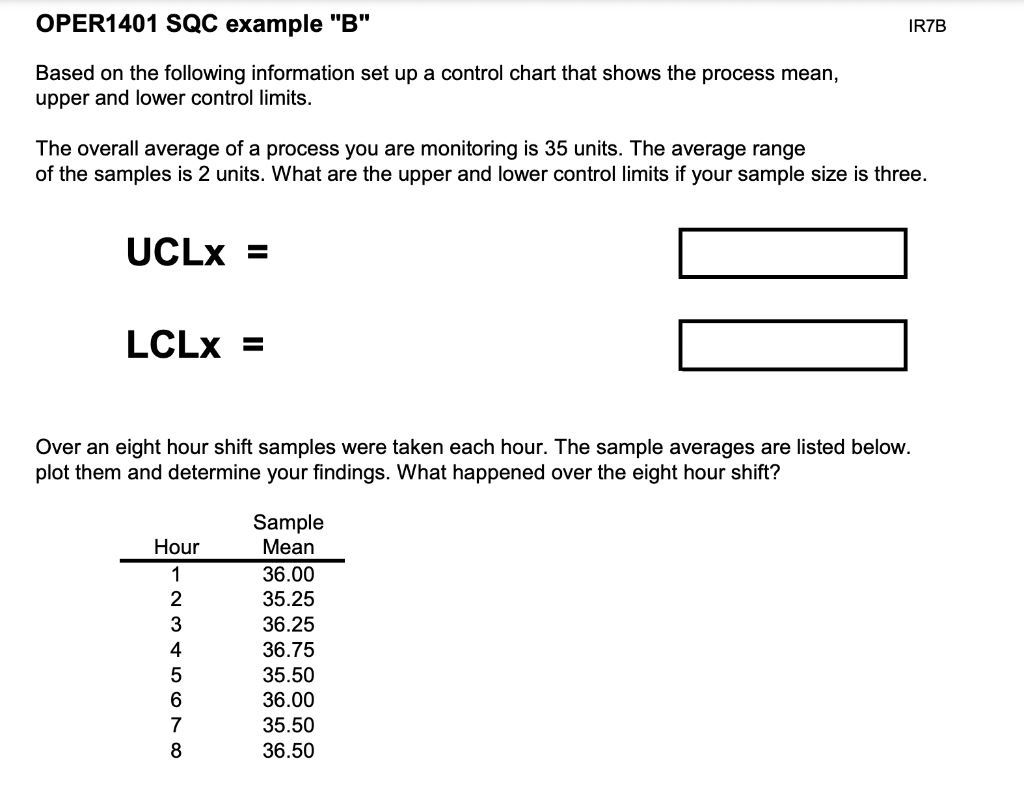
OPER1401 SQC example "B" Based on the following information set up a control chart that shows the process mean, upper and lower control limits. The overall average of a process you are monitoring is 35 units. The average range of the samples is 2 units. What are the upper and lower control limits if your sample size is three. UCLX = LCLx = Over an eight hour shift samples were taken each hour. The sample averages are listed below. plot them and determine your findings. What happened over the eight hour shift
Step by Step Solution
There are 3 Steps involved in it
1 Expert Approved Answer
Step: 1 Unlock

Question Has Been Solved by an Expert!
Get step-by-step solutions from verified subject matter experts
Step: 2 Unlock
Step: 3 Unlock