

Question: please explain step by step (10 pts) The graph of the area accumulation function F(x) = g(t) dt is given below on the interval [0,
please explain step by step
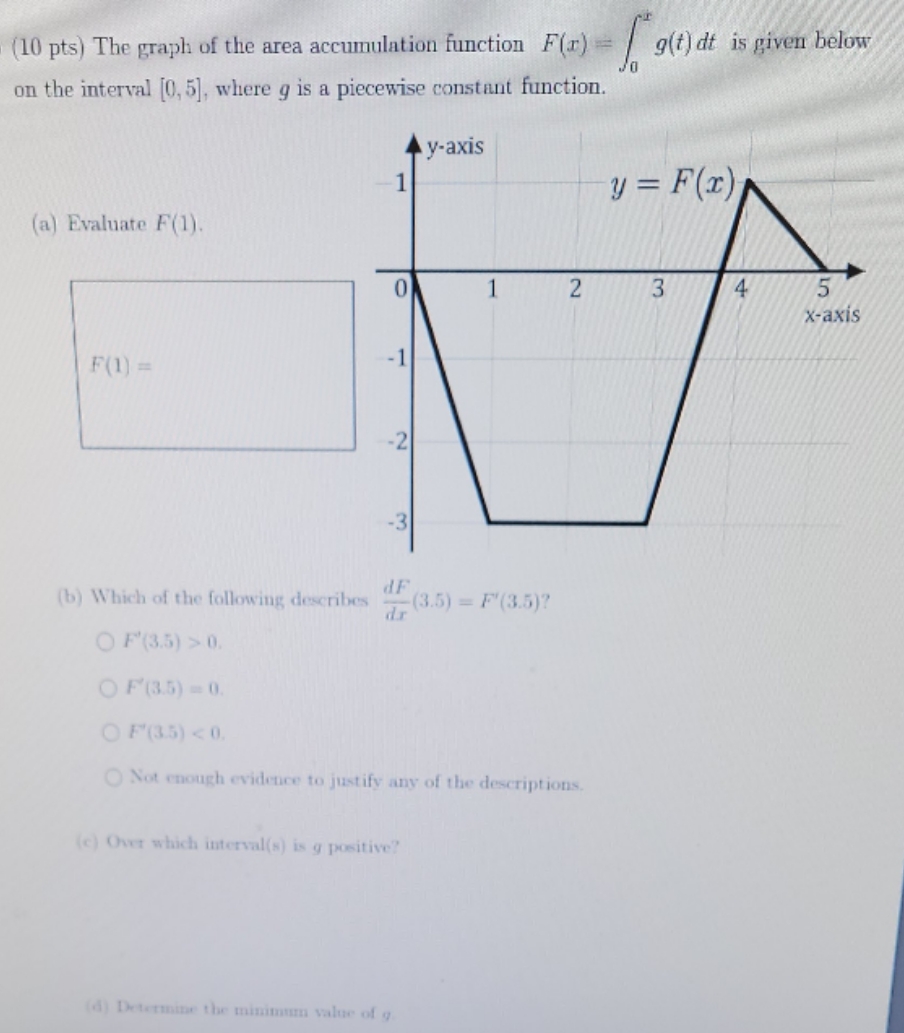
(10 pts) The graph of the area accumulation function F(x) = g(t) dt is given below on the interval [0, 5], where g is a piecewise constant function. y-axis 1 y = F(x) (a) Evaluate F(1). 0 1 2 3 4 5 x-axis F(1) = -1 -2 -3 (b) Which of the following describes dF (3.5) = F(3.5)? OF(3.5) > 0. OF (3.5) - 0 OF(35)
Step by Step Solution
There are 3 Steps involved in it
1 Expert Approved Answer
Step: 1 Unlock

Question Has Been Solved by an Expert!
Get step-by-step solutions from verified subject matter experts
Step: 2 Unlock
Step: 3 Unlock