

Question: please explain step by step The following table contains the demand from the last 12 months: a. Please create a spreadsheet and do forecasting by
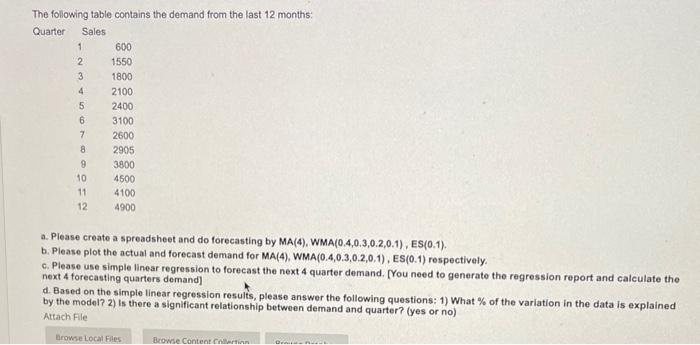
The following table contains the demand from the last 12 months: a. Please create a spreadsheet and do forecasting by MA(4), WMA(0.4,0.3,0.2,0.1), ES(0.1). b. Please plot the actual and forecast demand for MA(4), WMA (0.4,0.3,0.2,0,1),ES(0.1) respectively. c. Please use simple linear regression to forecast the next 4 quarter demand. [You need to generate the regression report and calculate the next 4 forecasting quarters demand] d. Based on the simple linear regression results, please answer the following questions: 1) What % of the variation in the data is explained by the model? 2) Is there a significant relationship between demand and quarter? (yes or no) Attach File The following table contains the demand from the last 12 months: a. Please create a spreadsheet and do forecasting by MA(4), WMA(0.4,0.3,0.2,0.1), ES(0.1). b. Please plot the actual and forecast demand for MA(4), WMA (0.4,0.3,0.2,0,1),ES(0.1) respectively. c. Please use simple linear regression to forecast the next 4 quarter demand. [You need to generate the regression report and calculate the next 4 forecasting quarters demand] d. Based on the simple linear regression results, please answer the following questions: 1) What % of the variation in the data is explained by the model? 2) Is there a significant relationship between demand and quarter? (yes or no) Attach File
Step by Step Solution
There are 3 Steps involved in it

Get step-by-step solutions from verified subject matter experts