

Question: please explain steps, it will be really helpful to understand Comparative income statement data for Manitou Ltd. And Muskola Ltd., two competitors, are shown below
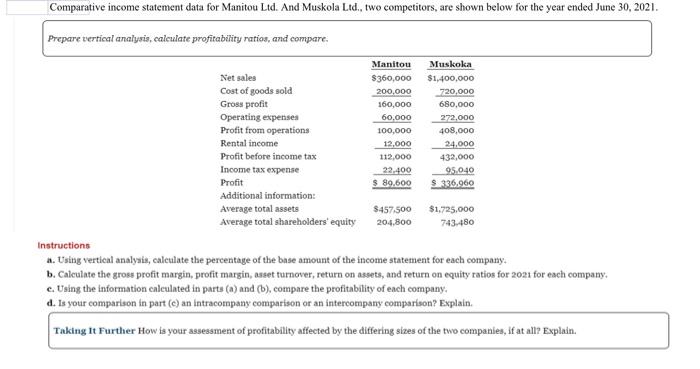
Comparative income statement data for Manitou Ltd. And Muskola Ltd., two competitors, are shown below for the year ended June 30, 2021. Prepare vertical analysis, calculate profitability ratios, and compare. Manitou Muskoka Net sales $360,000 $1,400,000 Cost of goods sola 200,000 720,000 Gross profit 160,000 680,000 Operating expenses 60.000 272,000 Profit from operations 100,000 408,000 Rental income 12,000 24,000 Profit before income tax 112,000 432,000 Income tax expense 22.400 95.040 Profit $ 80.600 $ 336,060 Additional information: Average total assets $457.500 $1,725,000 Average total shareholders' equity 204,800 743.480 Instructions a. Using vertical analysis, calculate the percentage of the base amount of the income statement for each company. b. Calculate the gross profit margin, profit margin, asset turnover, return on assets, and return on equity ratios for 2021 for each company, e. Using the information calculated in parts (a) and (b), compare the profitability of each company. d. Is your comparison in part (e) an intracompany comparison or an intercompany comparison? Explain Taking It Further How is your assessment of profitability affected by the differing sizes of the two companies, if at all? Explain
Step by Step Solution
There are 3 Steps involved in it

Get step-by-step solutions from verified subject matter experts