

Question: Please explain. Thank you The table provides summary statistics on highway fuel economy of cars manufactured in 2012 [from Exercise 5.32}. Use these statistics to
Please explain. Thank you
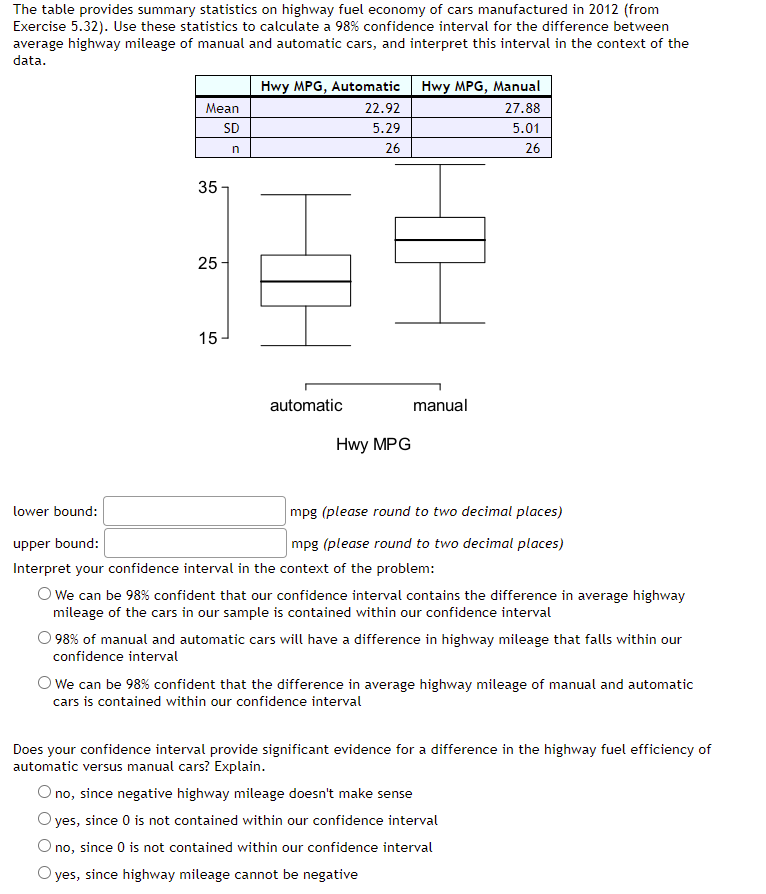
The table provides summary statistics on highway fuel economy of cars manufactured in 2012 [from Exercise 5.32}. Use these statistics to calculate a 93% confidence interval for the difference between average highway mileage of manual and automatic cars, and interpret this interval in the context of the data. Hwy MFG, Automatic Hwy MFG, Manual Il automatic manual Hwy MPG lower bound: :] mpg {pieose round to two decimal' pieces} upper bound: |:] mpg {please round to two decimal places} Interpret your confidence interval in the context of the problem: 0 We can be 93% confident that our confidence interval contains the difference in average highway mileage of the cars in our sample is contained within our confidence interval O 93% of manual and automatic cars will have a difference in highway mileage that falls within our confidence interval 0 We can be 93% confident that the difference in average highway mileage of manual and automatic cars is contained within our confidence interval Does your confidence interval provide significant evidence for a difference in the highway fuel efficiency of automatic versus manual cars? Explain. O no, since negative highway mileage doesn't make sense O yes, since [1 is not contained within our confidence interval O no, since D is not contained within our confidence interval O yes, since highway mileage cannot be negative
Step by Step Solution
There are 3 Steps involved in it

Get step-by-step solutions from verified subject matter experts