

Question: Please explain the answer; I need to know the reason why so as to learn, thanks. Charge stability diagrams In the video, Lieven explained how
 Please explain the answer; I need to know the reason why so as to learn, thanks.
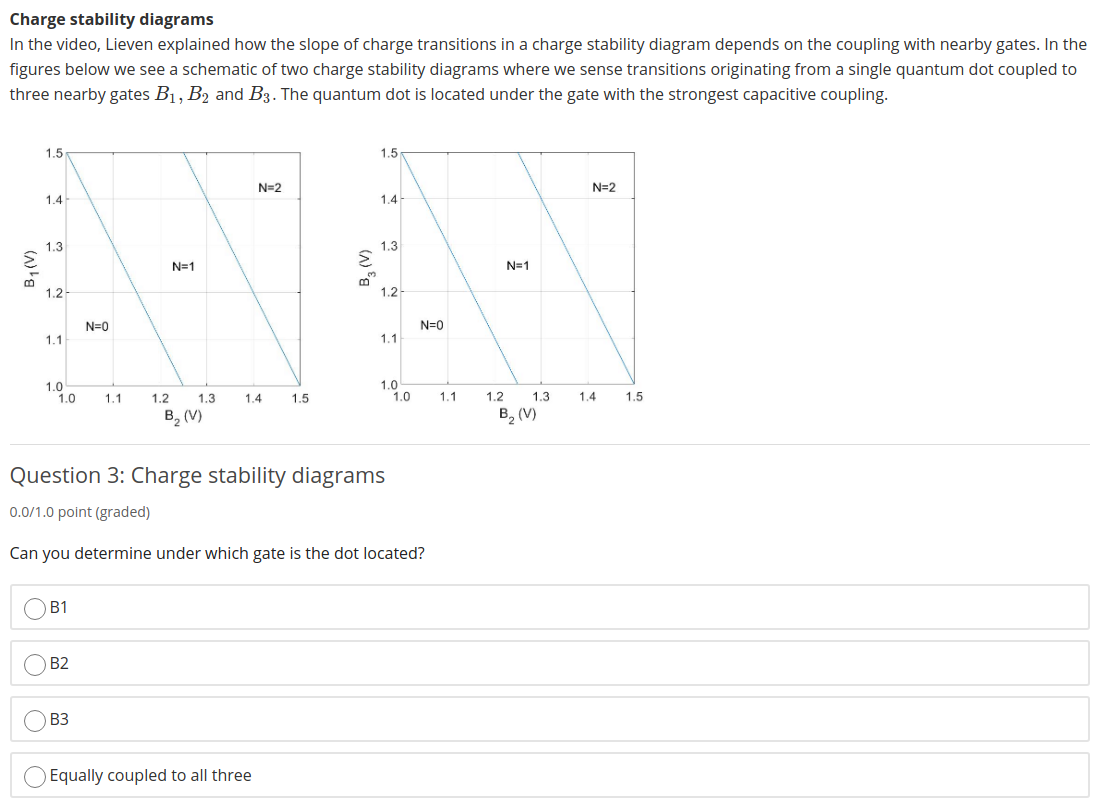
Charge stability diagrams In the video, Lieven explained how the slope of charge transitions in a charge stability diagram depends on the coupling with nearby gates. In the figures below we see a schematic of two charge stability diagrams where we sense transitions originating from a single quantum dot coupled to three nearby gates B1, B2 and B3. The quantum dot is located under the gate with the strongest capacitive coupling. 1.5 1.5 N=2 N=2 1.4 1.4 1.3 1.3 N=1 N=1 1.2 1.2 N=0 N=0 1.1 1.1 1.0 1.0 1.0 1.0 1.1 1.4 1.5 1.1 1.4 1.5 1.2 1.3 B (V) 1.2 1.3 B, (V) Question 3: Charge stability diagrams 0.0/1.0 point (graded) Can you determine under which gate is the dot located? B1 B2 B3 Equally coupled to all three Charge stability diagrams In the video, Lieven explained how the slope of charge transitions in a charge stability diagram depends on the coupling with nearby gates. In the figures below we see a schematic of two charge stability diagrams where we sense transitions originating from a single quantum dot coupled to three nearby gates B1, B2 and B3. The quantum dot is located under the gate with the strongest capacitive coupling. 1.5 1.5 N=2 N=2 1.4 1.4 1.3 1.3 N=1 N=1 1.2 1.2 N=0 N=0 1.1 1.1 1.0 1.0 1.0 1.0 1.1 1.4 1.5 1.1 1.4 1.5 1.2 1.3 B (V) 1.2 1.3 B, (V) Question 3: Charge stability diagrams 0.0/1.0 point (graded) Can you determine under which gate is the dot located? B1 B2 B3 Equally coupled to all three
Step by Step Solution
There are 3 Steps involved in it

Get step-by-step solutions from verified subject matter experts