

Question: Please explain the answer step by step. Thank you. Table: III. Make the decision tree using the values from table 1 1. Make the decision
Please explain the answer step by step. Thank you.
Table:
III. Make the decision tree using the values from table 1
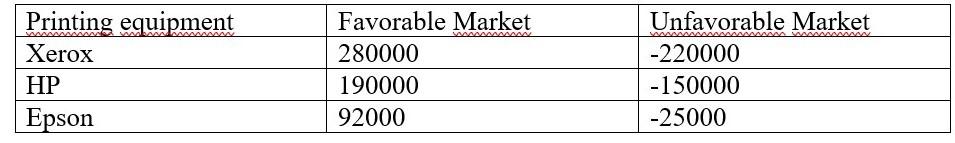
1. Make the decision tree using the data in Table I. Remember that the probability of the favorable market is .60 and the probability of the unfavorable market is .40.
2. A market study was conducted to evaluate printer supplier companies. The cost of the study was $ 15,000.
a. Make a decision tree including the results of the study. The probability of favorable study results is .70.
b. A review of probabilities was carried out when these were favorable and not favorable. Use Bayes' theorem to find the probabilities that you will use for the tree diagram when considering a study. In the next table you have the prior probabilities.
| State of nature | Conditional probability (Negative Study Probability State of Nature | Prior probability | Joint Probability | Probability of state of nature Negative studies |
| FM (Market Favorable) | .68 | .60 | ||
| UM (Market unfavorable) | .30 | .40 |
| State of nature | Conditional probability (Negative Study Probability State of Nature | Prior probability | Joint Probability | probability of state of nature negative studies |
| FM (Market favorable) | .32 | .60 | ||
| UM (Market Unfavorable) | .70 | .40 |
3. Find all the nodes in the decision tree.
4. Calculate the EVSI (Expected value of sample information)
5. Calculate the efficiency of having the information (Efficiency of sample information)
VAAAAAAAAAAAAA AAAAA Printing equipment Xerox HP Epson Favorable Market 280000 190000 92000 Unfavorable Market -220000 -150000 -25000 VAAAAAAAAAAAAA AAAAA Printing equipment Xerox HP Epson Favorable Market 280000 190000 92000 Unfavorable Market -220000 -150000 -25000
Step by Step Solution
There are 3 Steps involved in it

Get step-by-step solutions from verified subject matter experts