

Question: Please explain the difference between the two highlighted lines in the following figure when selecting candidates for harris points and how they affect plotting the
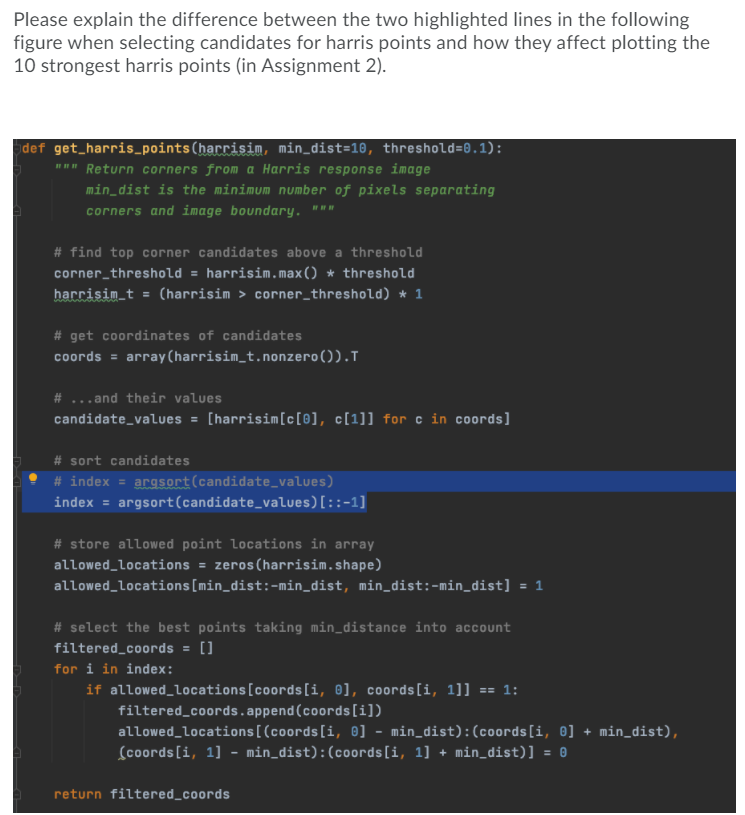
Please explain the difference between the two highlighted lines in the following figure when selecting candidates for harris points and how they affect plotting the 10 strongest harris points in Assignment 2). def get_harris_points(harrisim, min_dist=10, threshold=6.1): " Return corners from a Harris response image min_dist is the minimum number of pixels separating corners and image boundary. " # find top corner candidates above a threshold corner_threshold = harrisim.max() * threshold harrisim_t = (harrisim > corner_threshold) * 1 # get coordinates of candidates coords = array(harrisin_t.nonzero()).T # ... and their values candidate_values = [harrisim[c[0], c[1]] for c in coords] # sort candidates # index = argsort(candidate_values) index = argsort(candidate_values)[::-1] # store allowed point locations in array allowed_locations = zeros(harrisim.shape) allowed_locations[min_dist:-min_dist, min_dist:-min_dist] = 1 # select the best points taking min_distance into account filtered_coords = [] for i in index: if allowed_locations [coords[i, o), coords[i, 1]] == 1: filtered_coords.append(coords[i]) allowed_locations[(coords[i, ] - min_dist): (coords[i, 0] + min_dist), (coords[i, 1] - min_dist):(coords[i, 1] + min_dist)] = 0 return filtered_coords
Step by Step Solution
There are 3 Steps involved in it

Get step-by-step solutions from verified subject matter experts