

Question: please explain :) The following figure contains information based on analyst's forecasts for three stocks. Assume a risk-free rate of 7% and a market return
please explain :)
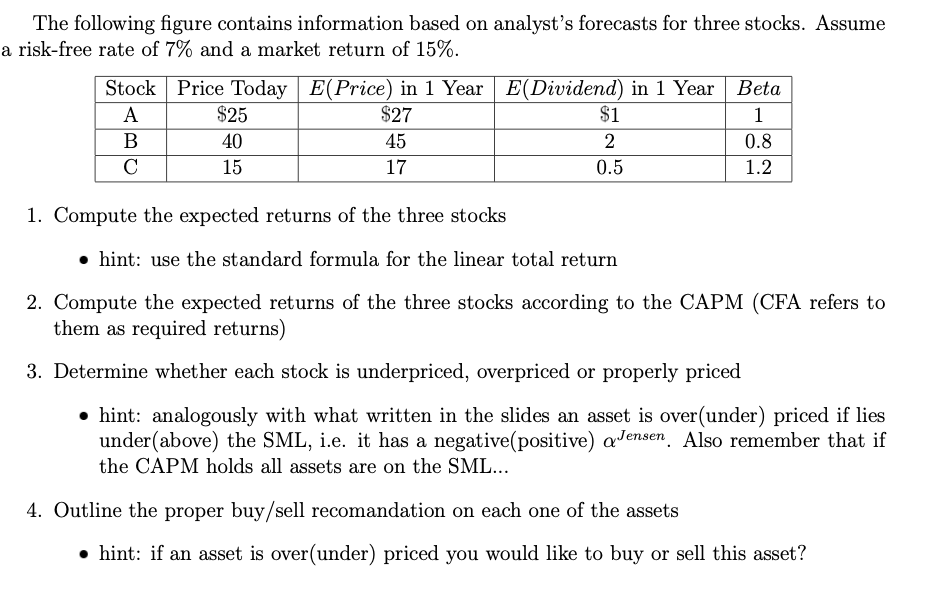
The following figure contains information based on analyst's forecasts for three stocks. Assume a risk-free rate of 7% and a market return of 15%. Stock Price Today E(Price) in 1 Year E(Dividend) in 1 Year A $25 $27 $1 B 40 45 2 C 15 17 0.5 Beta 1 0.8 1.2 1. Compute the expected returns of the three stocks hint: use the standard formula for the linear total return 2. Compute the expected returns of the three stocks according to the CAPM (CFA refers to them as required returns) 3. Determine whether each stock is underpriced, overpriced or properly priced hint: analogously with what written in the slides an asset is over(under) priced if lies under(above) the SML, i.e. it has a negative(positive) @ Jensen. Also remember that if the CAPM holds all assets are on the SML... 4. Outline the proper buy/ sell recomandation on each one of the assets hint: if an asset is over(under) priced you would like to buy or sell this asset
Step by Step Solution
There are 3 Steps involved in it

Get step-by-step solutions from verified subject matter experts