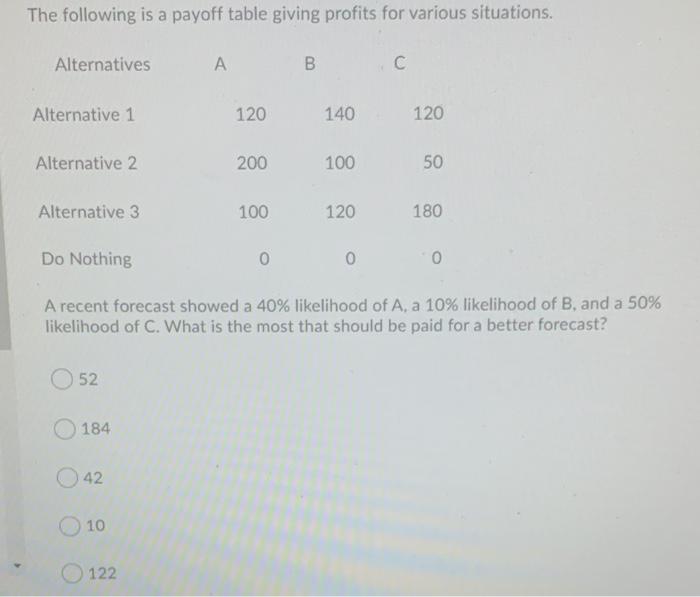
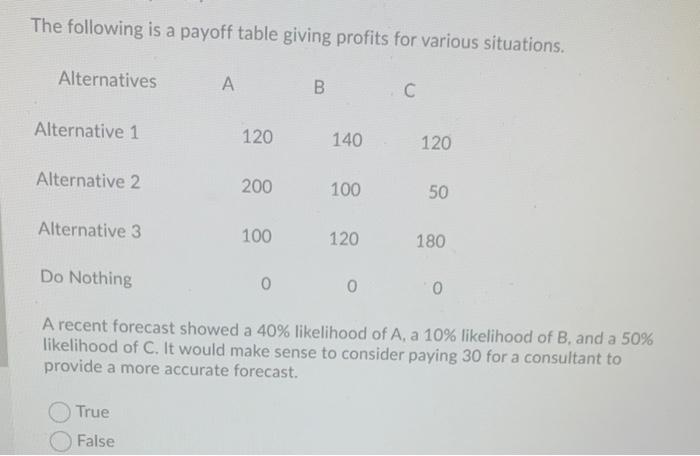
Question: please explain! The following is a payoff table giving profits for various situations. Alternatives A B C Alternative 1 120 140 120 Alternative 2 200

please explain! The following is a payoff table
please explain!
The following is a payoff table giving profits for various situations. Alternatives A B C Alternative 1 120 140 120 Alternative 2 200 100 50 Alternative 3 100 120 180 Do Nothing 0 0 A recent forecast showed a 40% likelihood of A, a 10% likelihood of B, and a 50% likelihood of C. What is the most that should be paid for a better forecast? 52 184 O 42 10 122 The following is a payoff table giving profits for various situations. Alternatives B. Alternative 1 120 140 120 Alternative 2 200 100 50 Alternative 3 100 120 180 Do Nothing 0 0 0 A recent forecast showed a 40% likelihood of A, a 10% likelihood of B, and a 50% likelihood of C. It would make sense to consider paying 30 for a consultant to provide a more accurate forecast. True False The following is a payoff table giving profits for various situations. Alternatives B Alternative 1 120 140 120 Alternative 2 200 100 50 Alternative 3 100 120 180 Do Nothing 0 0 0 A recent forecast showed a 40% likelihood of A, a 10% likelihood of B. and a 50% likelihood of C. Which alternative has an expected opportunity loss value of 622 Alternative 2 Do Nothing Alternative 1 Alternative 3 None of the choices are correct

Step by Step Solution

There are 3 Steps involved in it

1 Expert Approved Answer
Step: 1 Unlock blur-text-image
Question Has Been Solved by an Expert!

Get step-by-step solutions from verified subject matter experts

Step: 2 Unlock
Step: 3 Unlock

Students Have Also Explored These Related General Management Questions!