

Question: Please explain the steps 8. The following table presents the numbers of employees, by age group, who were promoted, or not promoted, in a sample
Please explain the steps
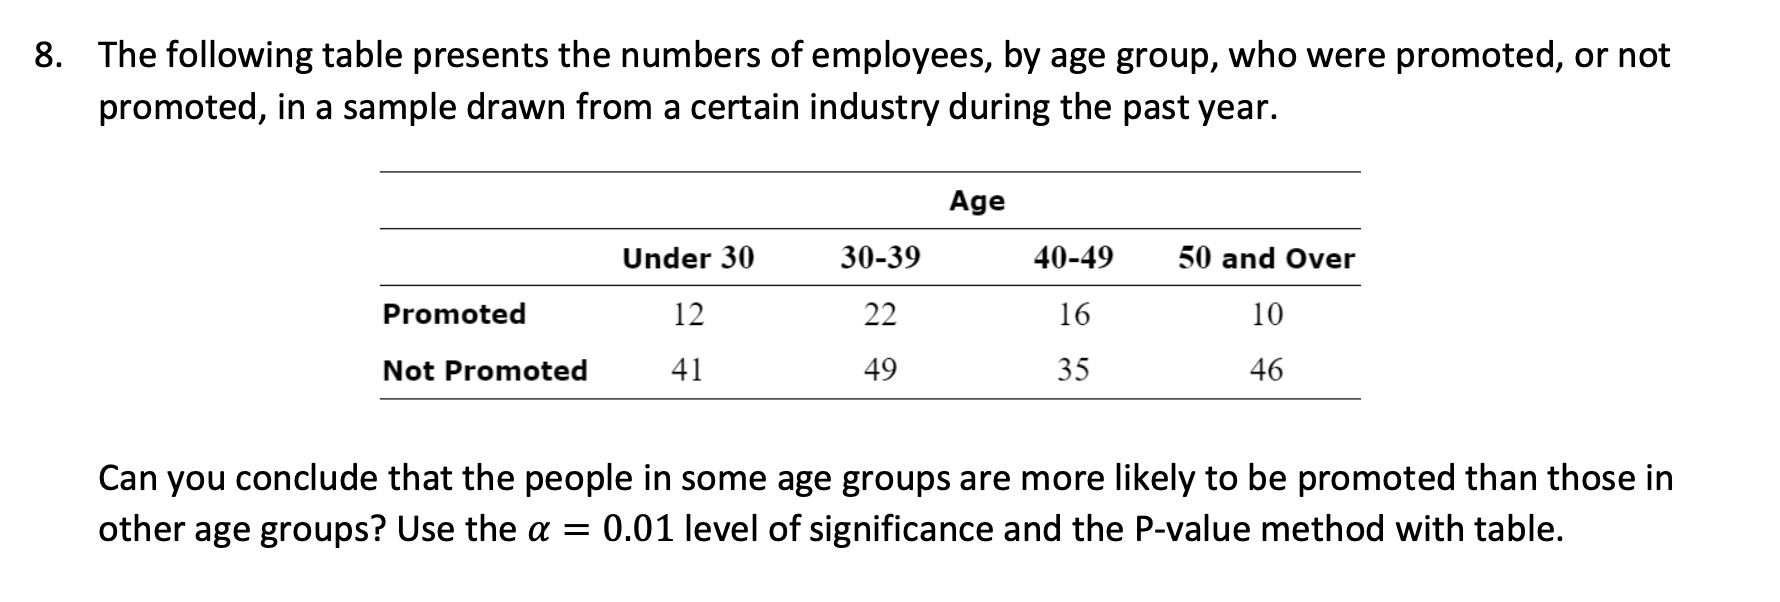
8. The following table presents the numbers of employees, by age group, who were promoted, or not promoted, in a sample drawn from a certain industry during the past year. Age Under 30 30-39 40-49 50 and Over Promoted 12 22 16 10 Not Promoted 41 49 35 46 Can you conclude that the people in some age groups are more likely to be promoted than those in other age groups? Use the a = 0.01 level of significance and the P-value method with table
Step by Step Solution
There are 3 Steps involved in it
1 Expert Approved Answer
Step: 1 Unlock

Question Has Been Solved by an Expert!
Get step-by-step solutions from verified subject matter experts
Step: 2 Unlock
Step: 3 Unlock