

Question: Please explain this as well. 2. Cliff Ave United, a Burnaby youth soccer club, was established in 1956. You can see many of its ads
Please explain this as well.
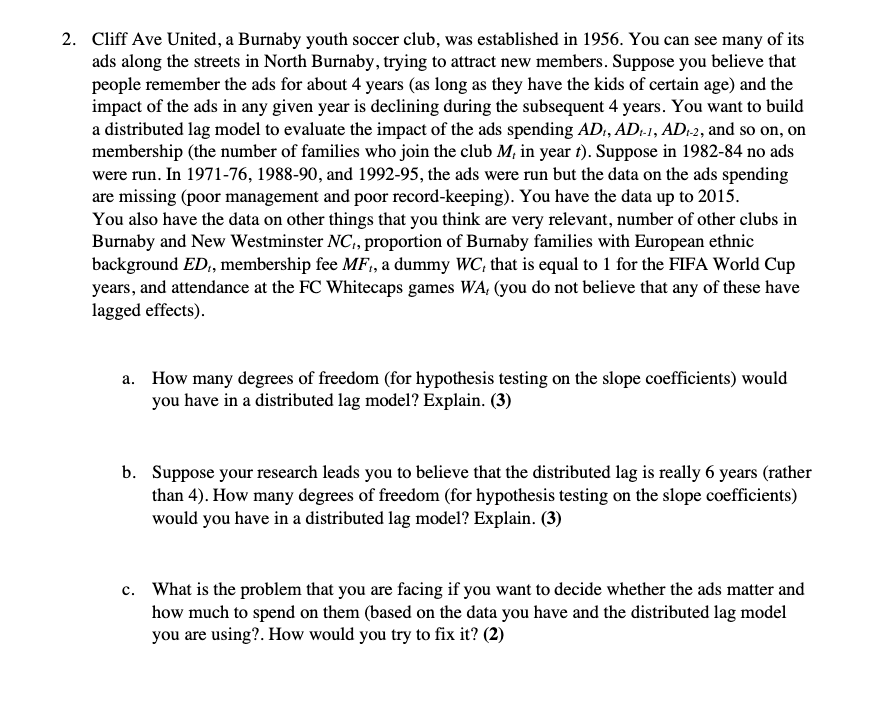
2. Cliff Ave United, a Burnaby youth soccer club, was established in 1956. You can see many of its ads along the streets in North Burnaby, trying to attract new members. Suppose you believe that people remember the ads for about 4 years (as long as they have the kids of certain age) and the impact of the ads in any given year is declining during the subsequent 4 years. You want to build a distributed lag model to evaluate the impact of the ads spending AD, AD:-1, AD-2, and so on, on membership (the number of families who join the club M, in year t). Suppose in 1982-84 no ads were run. In 1971-76, 1988-90, and 1992-95, the ads were run but the data on the ads spending are missing (poor management and poor record-keeping). You have the data up to 2015. You also have the data on other things that you think are very relevant, number of other clubs in Burnaby and New Westminster NC, proportion of Burnaby families with European ethnic background ED., membership fee MF., a dummy WC, that is equal to 1 for the FIFA World Cup years, and attendance at the FC Whitecaps games WA, (you do not believe that any of these have lagged effects). a. How many degrees of freedom (for hypothesis testing on the slope coefficients) would you have in a distributed lag model? Explain. (3) b. Suppose your research leads you to believe that the distributed lag is really 6 years (rather than 4). How many degrees of freedom (for hypothesis testing on the slope coefficients) would you have in a distributed lag model? Explain. (3) c. What is the problem that you are facing if you want to decide whether the ads matter and how much to spend on them (based on the data you have and the distributed lag model you are using?. How would you try to fix it? (2) 2. Cliff Ave United, a Burnaby youth soccer club, was established in 1956. You can see many of its ads along the streets in North Burnaby, trying to attract new members. Suppose you believe that people remember the ads for about 4 years (as long as they have the kids of certain age) and the impact of the ads in any given year is declining during the subsequent 4 years. You want to build a distributed lag model to evaluate the impact of the ads spending AD, AD:-1, AD-2, and so on, on membership (the number of families who join the club M, in year t). Suppose in 1982-84 no ads were run. In 1971-76, 1988-90, and 1992-95, the ads were run but the data on the ads spending are missing (poor management and poor record-keeping). You have the data up to 2015. You also have the data on other things that you think are very relevant, number of other clubs in Burnaby and New Westminster NC, proportion of Burnaby families with European ethnic background ED., membership fee MF., a dummy WC, that is equal to 1 for the FIFA World Cup years, and attendance at the FC Whitecaps games WA, (you do not believe that any of these have lagged effects). a. How many degrees of freedom (for hypothesis testing on the slope coefficients) would you have in a distributed lag model? Explain. (3) b. Suppose your research leads you to believe that the distributed lag is really 6 years (rather than 4). How many degrees of freedom (for hypothesis testing on the slope coefficients) would you have in a distributed lag model? Explain. (3) c. What is the problem that you are facing if you want to decide whether the ads matter and how much to spend on them (based on the data you have and the distributed lag model you are using?. How would you try to fix it? (2)
Step by Step Solution
There are 3 Steps involved in it

Get step-by-step solutions from verified subject matter experts