

Question: please explain this dynamic multiplier graph that given Cumulative Dynamic Multiplier: @LOG(ER) on @LOG(KLCI) Shock Evolution 4 3 2 1 0 -1 5 10 15
please explain this dynamic multiplier graph that given
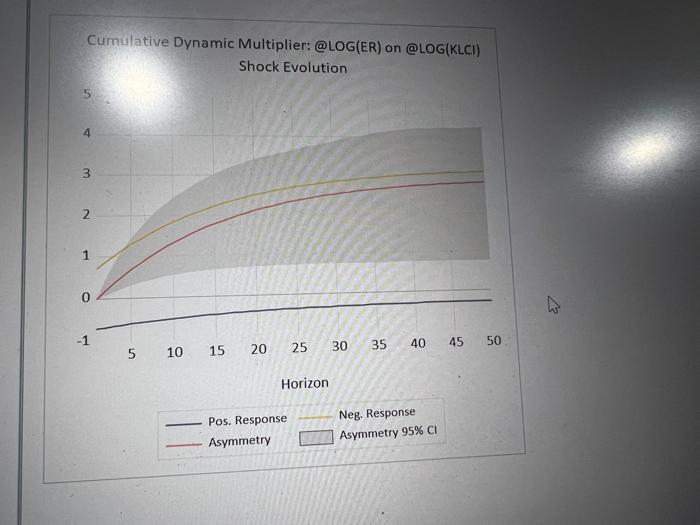
Cumulative Dynamic Multiplier: @LOG(ER) on @LOG(KLCI) Shock Evolution 4 3 2 1 0 -1 5 10 15 20 25 Horizon Pos. Response Asymmetry 30 35 40 45 50 Neg. Response Asymmetry 95% CI
Step by Step Solution
★★★★★
3.40 Rating (153 Votes )
There are 3 Steps involved in it
1 Expert Approved Answer
Step: 1 Unlock

Step 2 Graphical representation Solution Here the multiplier is not the stat... View full answer
Question Has Been Solved by an Expert!
Get step-by-step solutions from verified subject matter experts
Step: 2 Unlock
Step: 3 Unlock