

Question: Please explain this graph and the different points mean? Fig. 6.1 1 Supply and demand in the labour market W/P W/P MP!- From this equation
Please explain this graph and the different points mean?

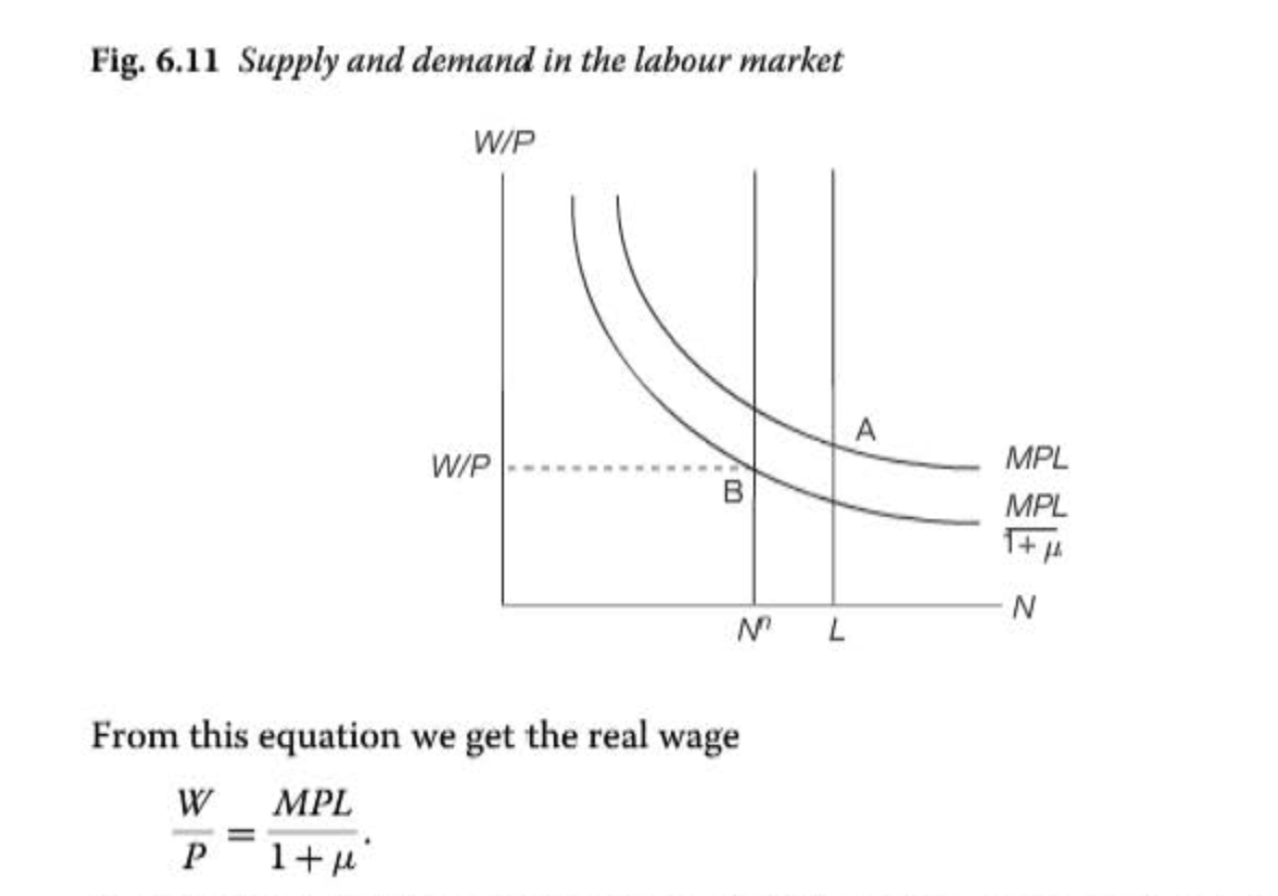
Fig. 6.1 1 Supply and demand in the labour market W/P W/P MP!- From this equation we get the real wage W MPL '17 l+n
Step by Step Solution
There are 3 Steps involved in it
1 Expert Approved Answer
Step: 1 Unlock

Question Has Been Solved by an Expert!
Get step-by-step solutions from verified subject matter experts
Step: 2 Unlock
Step: 3 Unlock