

Question: Please explain this graph thoroughly Risk taker Risk averter r C 1 .0 Annual probability of survival FIGURE 15.13 The Optimal WageSafety Combination Risk takers
Please explain this graph thoroughly
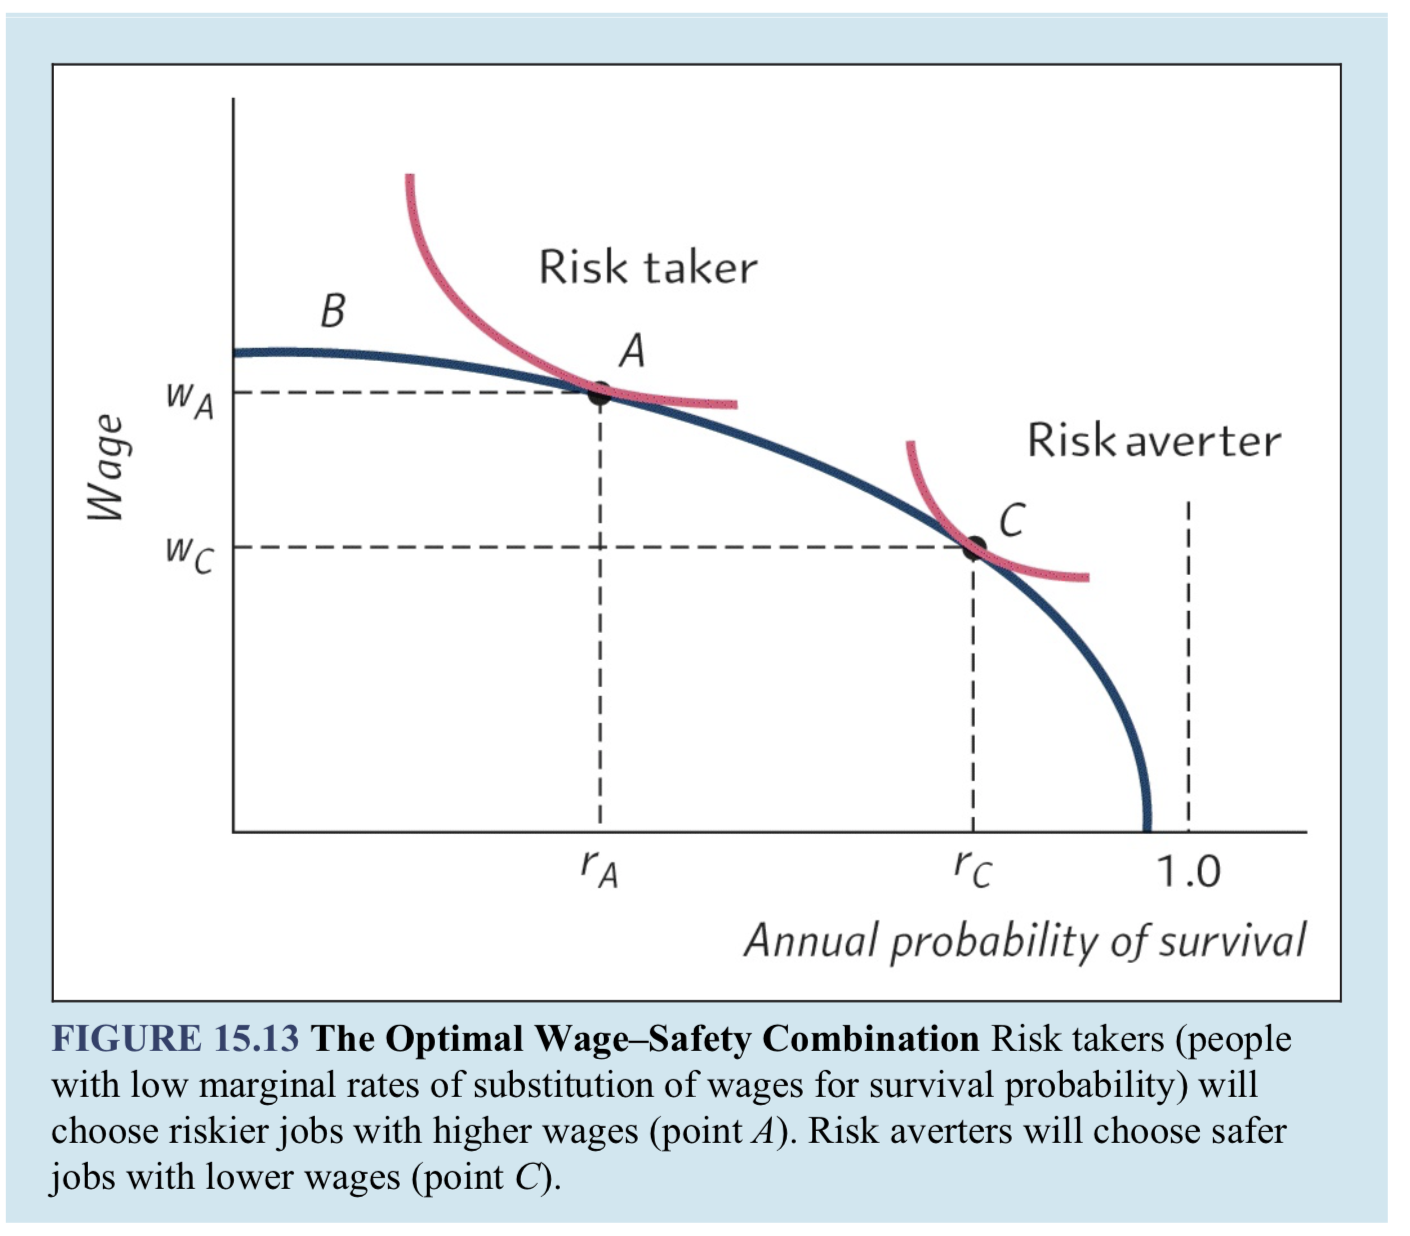
Risk taker Risk averter r C 1 .0 Annual probability of survival FIGURE 15.13 The Optimal WageSafety Combination Risk takers (people with low marginal rates of substitution of wages for survival probability) will choose riskier jobs with higher wages (point A). Risk averters will choose safer jobs with lower wages (point C)
Step by Step Solution
There are 3 Steps involved in it
1 Expert Approved Answer
Step: 1 Unlock

Question Has Been Solved by an Expert!
Get step-by-step solutions from verified subject matter experts
Step: 2 Unlock
Step: 3 Unlock