

Question: Please explain what you understand from the graphic below (remember our discussions on this graph during class time). How do you tie the concept depicted
Please explain what you understand from the graphic below (remember our discussions on this graph during class time). How do you tie the concept depicted in this graph to the differences in international finance as compared to domestic finance? You need to write the stock's story, explain what is happening in the graph and place it in the context of international finance to get full points.
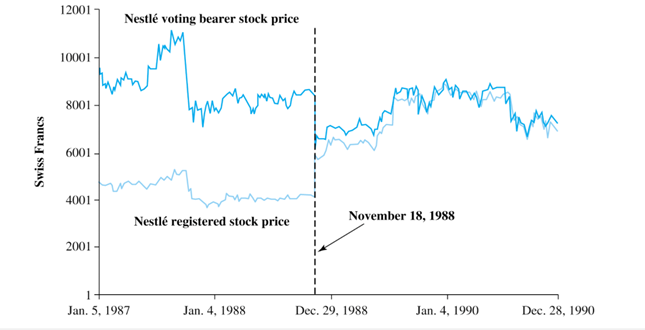
12001 Nestl voting bearer stock price 10001 Why 8001 - har Swiss Francs 6001 4001 Nestl registered stock price November 18, 1988 2001 1 Jan. 5, 1987 Jan. 4. 1988 Dec. 29. 1988 Jan. 4. 1990 Dec. 28, 1990
Step by Step Solution
There are 3 Steps involved in it
1 Expert Approved Answer
Step: 1 Unlock

Question Has Been Solved by an Expert!
Get step-by-step solutions from verified subject matter experts
Step: 2 Unlock
Step: 3 Unlock