

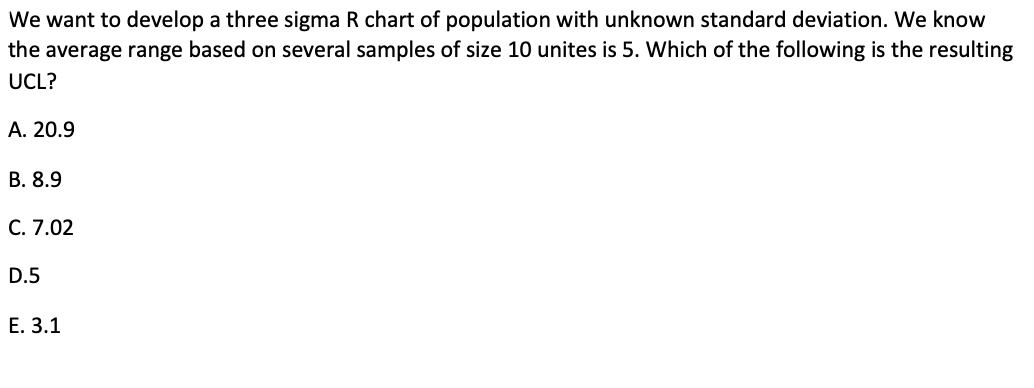
Question: Please explain where all numbers that are not given come from. We want to develop a three sigma R chart of population with unknown standard
 Please explain where all numbers that are not given come from.
Step by Step Solution
There are 3 Steps involved in it
1 Expert Approved Answer
Step: 1 Unlock

Question Has Been Solved by an Expert!
Get step-by-step solutions from verified subject matter experts
Step: 2 Unlock
Step: 3 Unlock