

Question: Please explain which formulas are needed to fill in the excel sheet. thanks so much! Cod Harvest Data and Fishermen Functional Response year boats The
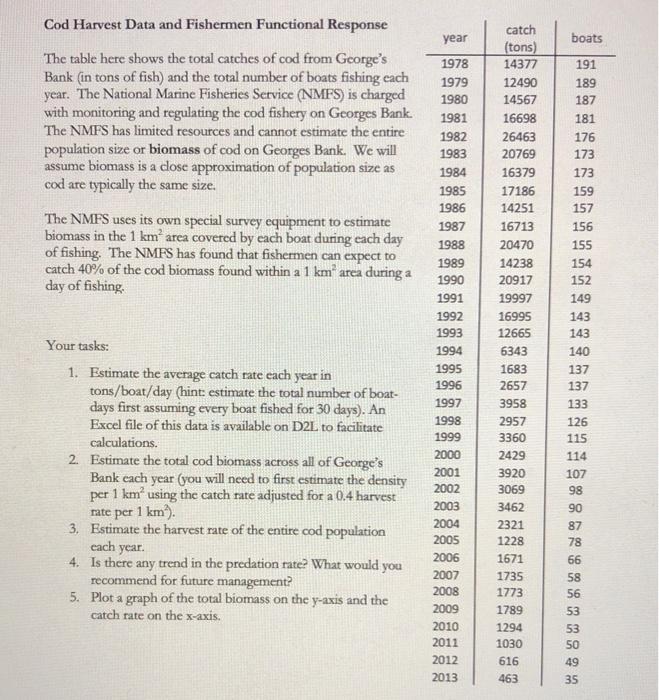
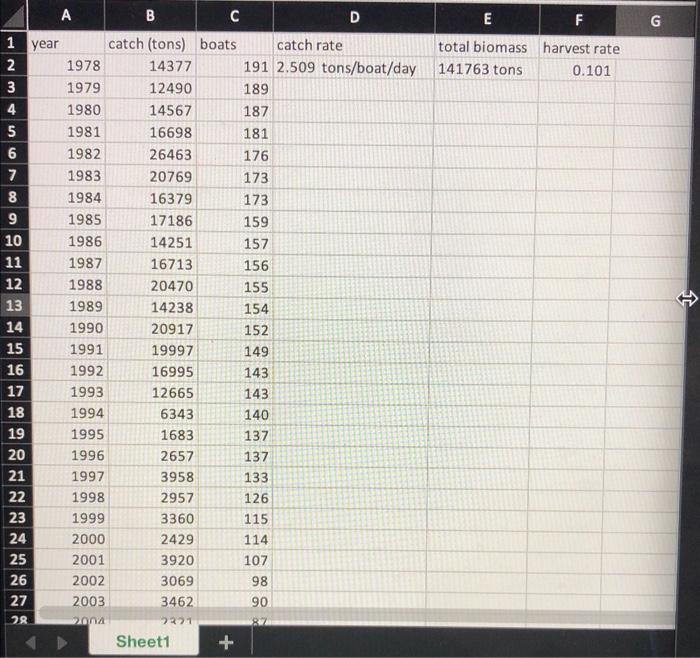
Cod Harvest Data and Fishermen Functional Response year boats The table here shows the total catches of cod from George's Bank (in tons of fish) and the total number of boats fishing each year. The National Marine Fisheries Service (NMFS) is charged with monitoring and regulating the cod fishery on Georges Bank The NMFS has limited resources and cannot estimate the entire population size or biomass of cod on Georges Bank. We will assume biomass is a close approximation of population size as cod are typically the same size. The NMFS uses its own special survey equipment to estimate biomass in the 1 km area covered by each boat during each day of fishing. The NMFS has found that fishermen can expect to catch 40% of the cod biomass found within a 1 km area during a day of fishing Your tasks: catch (tons) 14377 12490 14567 16698 26463 20769 16379 17186 14251 16713 20470 14238 20917 19997 16995 12665 6343 1683 2657 3958 2957 3360 2429 3920 3069 3462 2321 1228 1671 1735 1773 1789 1294 1030 616 463 1978 1979 1980 1981 1982 1983 1984 1985 1986 1987 1988 1989 1990 1991 1992 1993 1994 1995 1996 1997 1998 1999 2000 2001 2002 2003 2004 2005 2006 2007 2008 2009 2010 2011 2012 2013 191 189 187 181 176 173 173 159 157 156 155 154 152 149 143 143 140 137 137 133 1. Estimate the average catch rate each year in tons/boat/day (hint: estimate the total number of boat- days first assuming every boat fished for 30 days). An Excel file of this data is available on D2L to facilitate calculations. 2. Estimate the total cod biomass across all of George's Bank each year (you will need to first estimate the density per 1 km using the catch rate adjusted for a 0.4 harvest rate per 1 km) 3. Estimate the harvest rate of the entire cod population 4. Is there any trend in the predation rate? What would you recommend for future management? 5. Plot a graph of the total biomass on the y-axis and the catch rate on the x-axis. 126 115 114 107 98 90 87 78 66 58 56 53 cach year. 53 50 49 35 A B D G E F total biomass harvest rate 141763 tons 0.101 1 year 2 3 4 5 6 7 8 9 10 7 00 11 t 12 13 14 15 catch (tons) boats catch rate 1978 14377 191 2.509 tons/boat/day 1979 12490 189 1980 14567 187 1981 16698 181 1982 26463 176 1983 20769 173 1984 16379 173 1985 17186 159 1986 14251 157 1987 16713 156 1988 20470 155 1989 14238 154 1990 20917 152 1991 19997 149 1992 16995 143 1993 12665 143 1994 6343 140 1995 1683 137 1996 2657 137 1997 3958 133 1998 2957 126 1999 3360 115 2000 2429 114 2001 3920 107 2002 3069 98 2003 3462 90 20 7221 Sheet1 + 16 17 18 19 20 21 22 23 24 25 26 27 28 Cod Harvest Data and Fishermen Functional Response year boats The table here shows the total catches of cod from George's Bank (in tons of fish) and the total number of boats fishing each year. The National Marine Fisheries Service (NMFS) is charged with monitoring and regulating the cod fishery on Georges Bank The NMFS has limited resources and cannot estimate the entire population size or biomass of cod on Georges Bank. We will assume biomass is a close approximation of population size as cod are typically the same size. The NMFS uses its own special survey equipment to estimate biomass in the 1 km area covered by each boat during each day of fishing. The NMFS has found that fishermen can expect to catch 40% of the cod biomass found within a 1 km area during a day of fishing Your tasks: catch (tons) 14377 12490 14567 16698 26463 20769 16379 17186 14251 16713 20470 14238 20917 19997 16995 12665 6343 1683 2657 3958 2957 3360 2429 3920 3069 3462 2321 1228 1671 1735 1773 1789 1294 1030 616 463 1978 1979 1980 1981 1982 1983 1984 1985 1986 1987 1988 1989 1990 1991 1992 1993 1994 1995 1996 1997 1998 1999 2000 2001 2002 2003 2004 2005 2006 2007 2008 2009 2010 2011 2012 2013 191 189 187 181 176 173 173 159 157 156 155 154 152 149 143 143 140 137 137 133 1. Estimate the average catch rate each year in tons/boat/day (hint: estimate the total number of boat- days first assuming every boat fished for 30 days). An Excel file of this data is available on D2L to facilitate calculations. 2. Estimate the total cod biomass across all of George's Bank each year (you will need to first estimate the density per 1 km using the catch rate adjusted for a 0.4 harvest rate per 1 km) 3. Estimate the harvest rate of the entire cod population 4. Is there any trend in the predation rate? What would you recommend for future management? 5. Plot a graph of the total biomass on the y-axis and the catch rate on the x-axis. 126 115 114 107 98 90 87 78 66 58 56 53 cach year. 53 50 49 35 A B D G E F total biomass harvest rate 141763 tons 0.101 1 year 2 3 4 5 6 7 8 9 10 7 00 11 t 12 13 14 15 catch (tons) boats catch rate 1978 14377 191 2.509 tons/boat/day 1979 12490 189 1980 14567 187 1981 16698 181 1982 26463 176 1983 20769 173 1984 16379 173 1985 17186 159 1986 14251 157 1987 16713 156 1988 20470 155 1989 14238 154 1990 20917 152 1991 19997 149 1992 16995 143 1993 12665 143 1994 6343 140 1995 1683 137 1996 2657 137 1997 3958 133 1998 2957 126 1999 3360 115 2000 2429 114 2001 3920 107 2002 3069 98 2003 3462 90 20 7221 Sheet1 + 16 17 18 19 20 21 22 23 24 25 26 27 28
Step by Step Solution
There are 3 Steps involved in it

Get step-by-step solutions from verified subject matter experts