

Question: Please explain why is this chart suitable for visualization for monthy % on backorder for brand, forecase accuracy and forecast bias 6 on backorder by
Please explain why is this chart suitable for visualization for monthy % on backorder for brand, forecase accuracy and forecast bias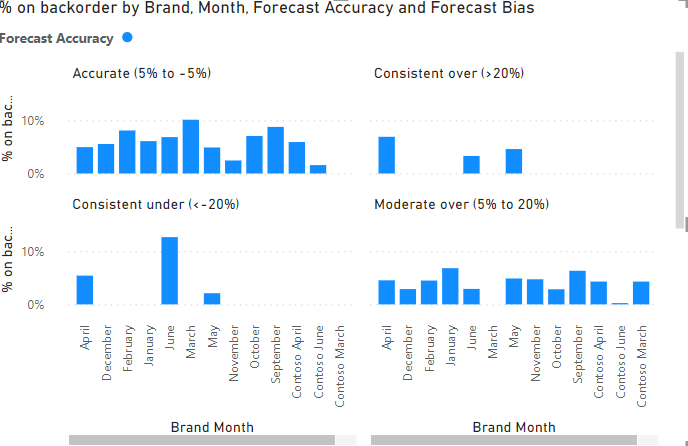
6 on backorder by Brand, Month, Forecast Accuracy and Forecast Bias orecast Accuracy
Step by Step Solution
There are 3 Steps involved in it
1 Expert Approved Answer
Step: 1 Unlock

Question Has Been Solved by an Expert!
Get step-by-step solutions from verified subject matter experts
Step: 2 Unlock
Step: 3 Unlock