

Question: Please explain why the graph is like this, both of the graph, and I dont understand why the shaded area is the consumer surplus? thanks.
Please explain why the graph is like this, both of the graph, and I dont understand why the shaded area is the consumer surplus? thanks.
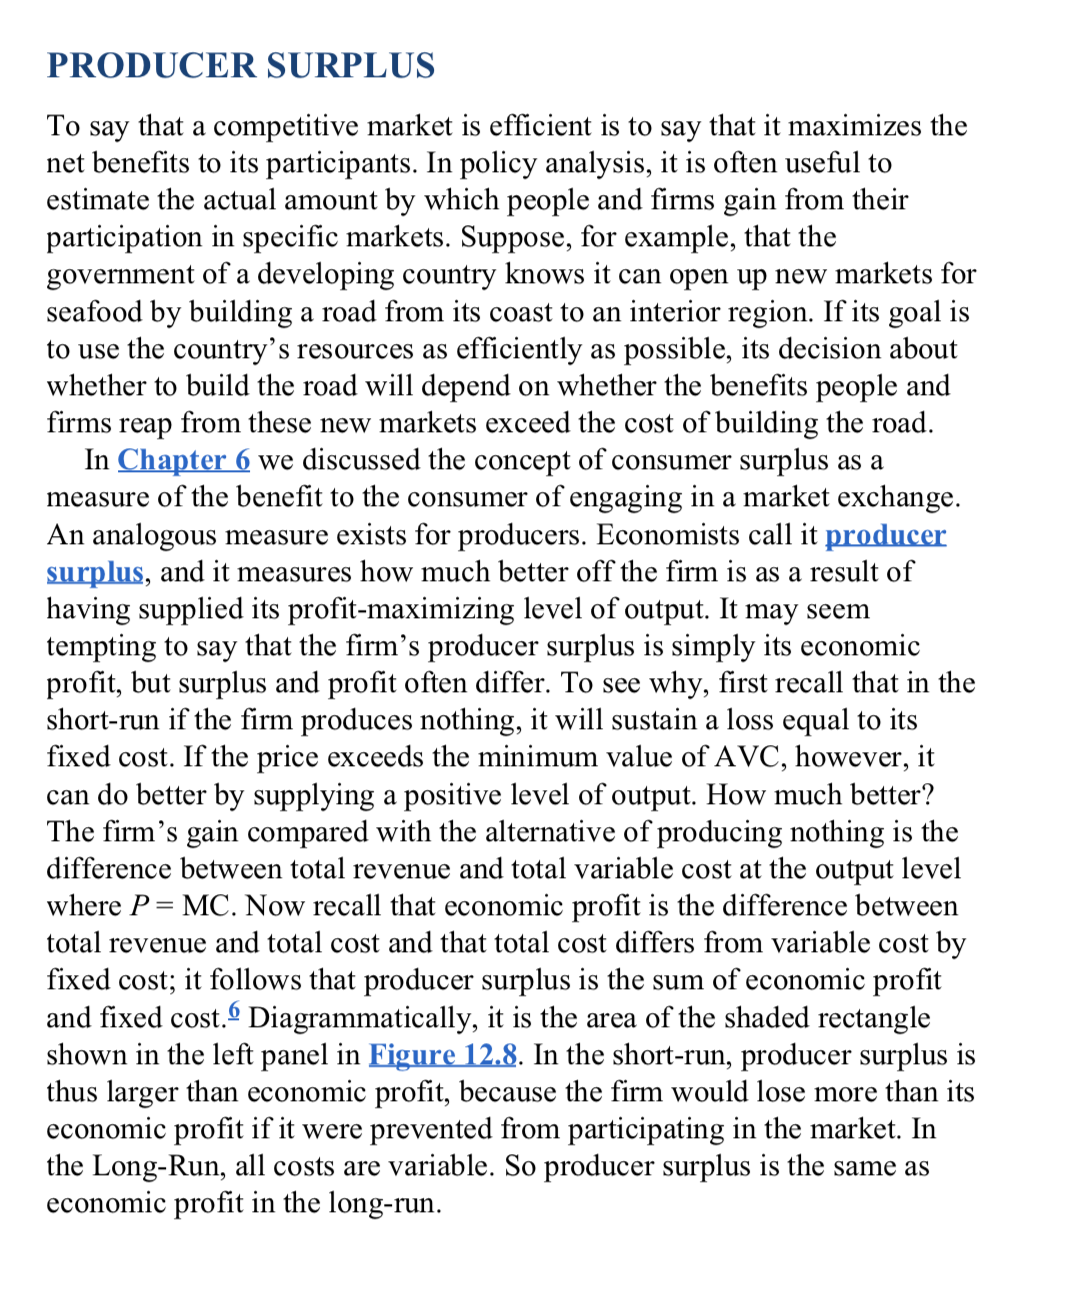
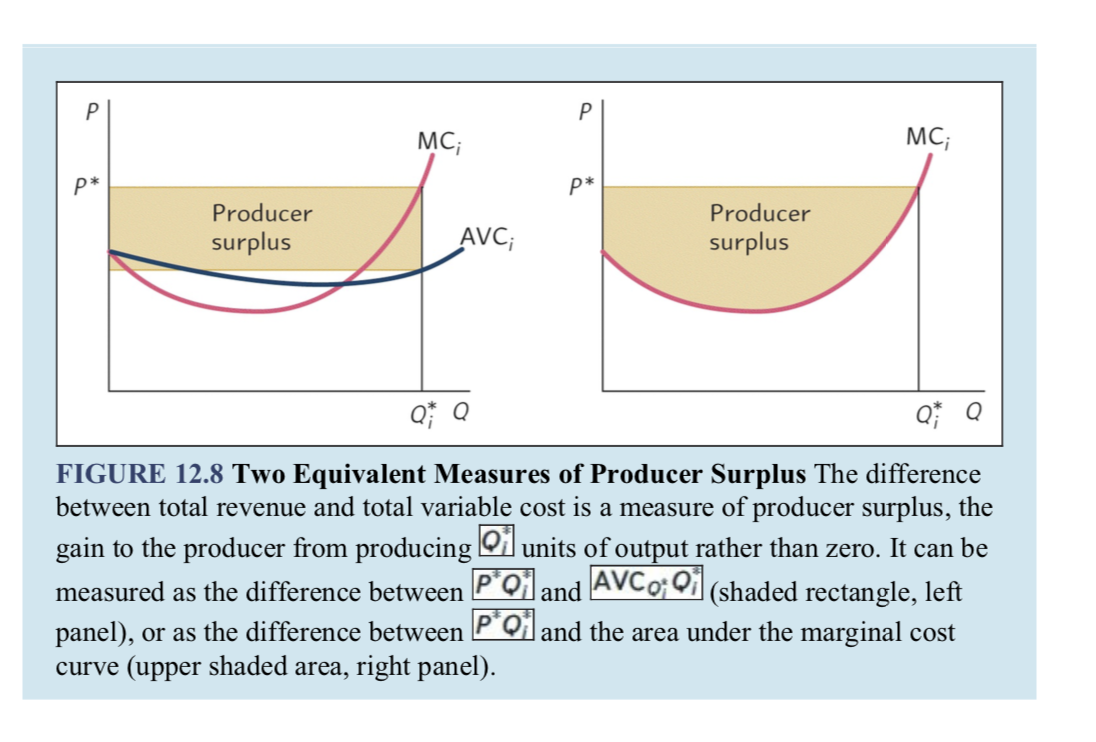
PRODUCER SURPLUS To say that a competitive market is efficient is to say that it maximizes the net benefits to its participants. In policy analysis, it is often useful to estimate the actual amount by which people and firms gain from their participation in specific markets. Suppose, for example, that the government of a developing country knows it can open up new markets for seafood by building a road from its coast to an interior region. If its goal is to use the country's resources as efficiently as possible, its decision about whether to build the road will depend on whether the benefits people and firms reap from these new markets exceed the cost of building the road. In Chapter 6 we discussed the concept of consumer surplus as a measure of the benefit to the consumer of engaging in a market exchange. An analogous measure exists for producers. Economists call it producer surplus, and it measures how much better off the firm is as a result of having supplied its profit-maximizing level of output. It may seem tempting to say that the firm's producer surplus is simply its economic profit, but surplus and profit often differ. To see why, first recall that in the short-run if the firm produces nothing, it will sustain a loss equal to its fixed cost. If the price exceeds the minimum value of A VC, however, it can do better by supplying a positive level of output. How much better? The firm's gain compared with the alternative of producing nothing is the difference between total revenue and total variable cost at the output level where P = MC. Now recall that economic profit is the difference between total revenue and total cost and that total cost differs from variable cost by fixed cost; it follows that producer surplus is the sum of economic profit and fixed cost." Diagrammatically, it is the area of the shaded rectangle shown in the left panel in Figure 12.8. In the short-run, producer surplus is thus larger than economic profit, because the firm would lose more than its economic profit if it were prevented from participating in the market. In the Long-Run, all costs are variable. So producer surplus is the same as economic profit in the long-run.P P MC; MC; P* P* Producer Producer surplus AVC; surplus Q Q Q* Q FIGURE 12.8 Two Equivalent Measures of Producer Surplus The difference between total revenue and total variable cost is a measure of producer surplus, the gain to the producer from producing Oi units of output rather than zero. It can be measured as the difference between P O and AVCo; Of (shaded rectangle, left panel), or as the difference between PO and the area under the marginal cost curve (upper shaded area, right panel)
Step by Step Solution
There are 3 Steps involved in it

Get step-by-step solutions from verified subject matter experts