

Question: Please explain why the Lac and sac looking like this? I am lost, explain the question, thanks! feel free to explain the concepts or any
Please explain why the Lac and sac looking like this? I am lost, explain the question, thanks! feel free to explain the concepts or any links!
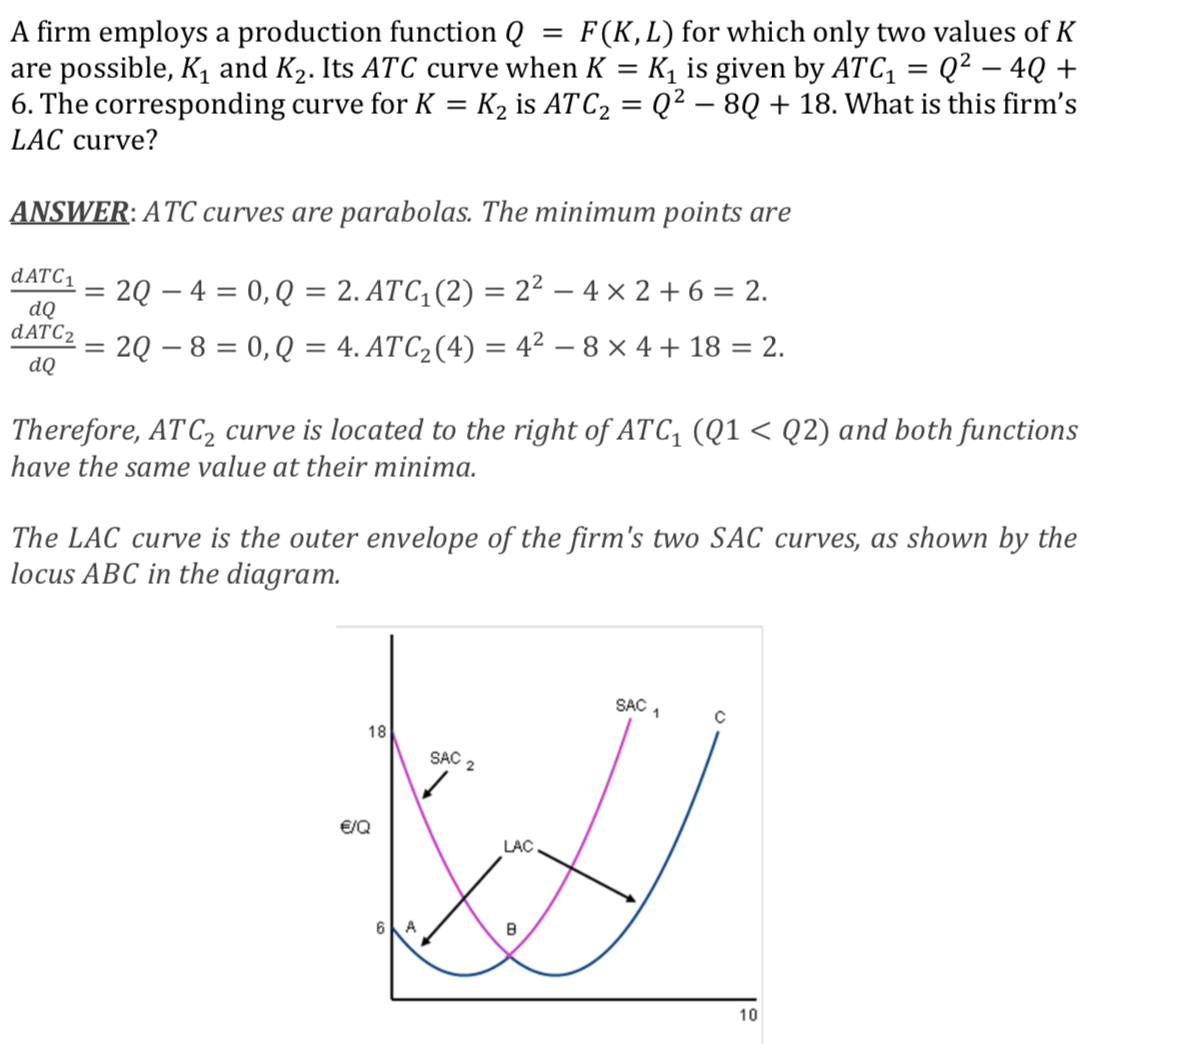
A rm employs a production function Q = F (K, L) for which only two values of K are possible, K1 and K2. lts ATC curve when X = K1 is given by ATC1 = Q2 - 4-0 + 6. The correSponding curve for K = K2 is ATCZ = Q2 80 + 18. What is this rm's LAC curve? ANSWER: ATC curves are parabolas. The minimum points are (1:261:204=0,Q=2.AT61(2)=22-4>
Step by Step Solution
There are 3 Steps involved in it
1 Expert Approved Answer
Step: 1 Unlock

Question Has Been Solved by an Expert!
Get step-by-step solutions from verified subject matter experts
Step: 2 Unlock
Step: 3 Unlock