

Question: Please explain why The table below gives the expected rate of return and the standard deviation of the rate of return for stocks ABC and
Please explain why
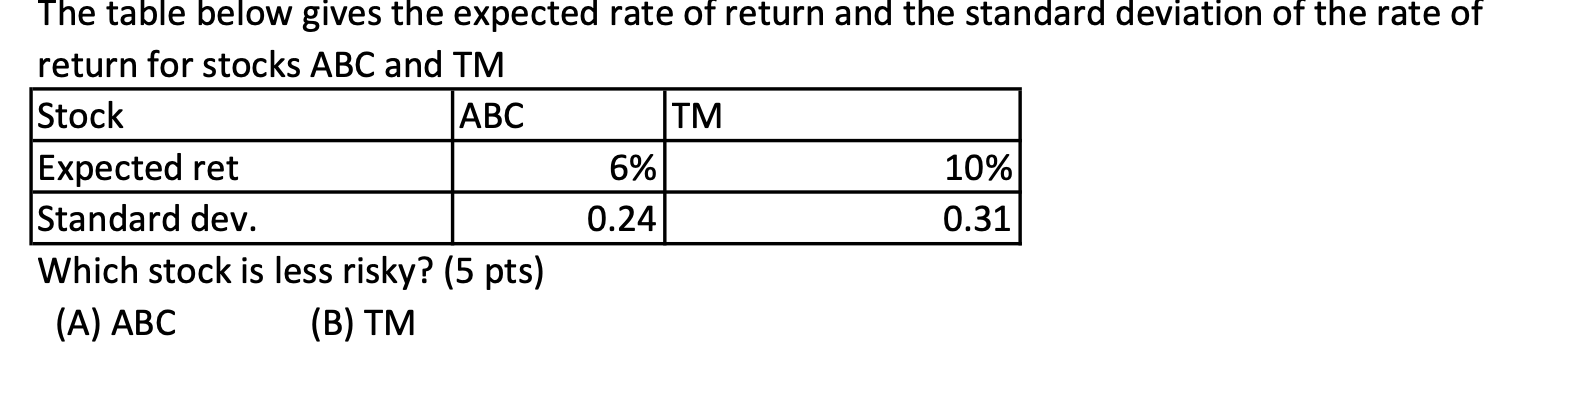
The table below gives the expected rate of return and the standard deviation of the rate of return for stocks ABC and TM Stock ABC TM Expected ret 6% 10% Standard dev. 0.24 0.31 Which stock is less risky? (5 pts) (A) ABC (B) TM
Step by Step Solution
There are 3 Steps involved in it
1 Expert Approved Answer
Step: 1 Unlock

Question Has Been Solved by an Expert!
Get step-by-step solutions from verified subject matter experts
Step: 2 Unlock
Step: 3 Unlock